Fig. 12.
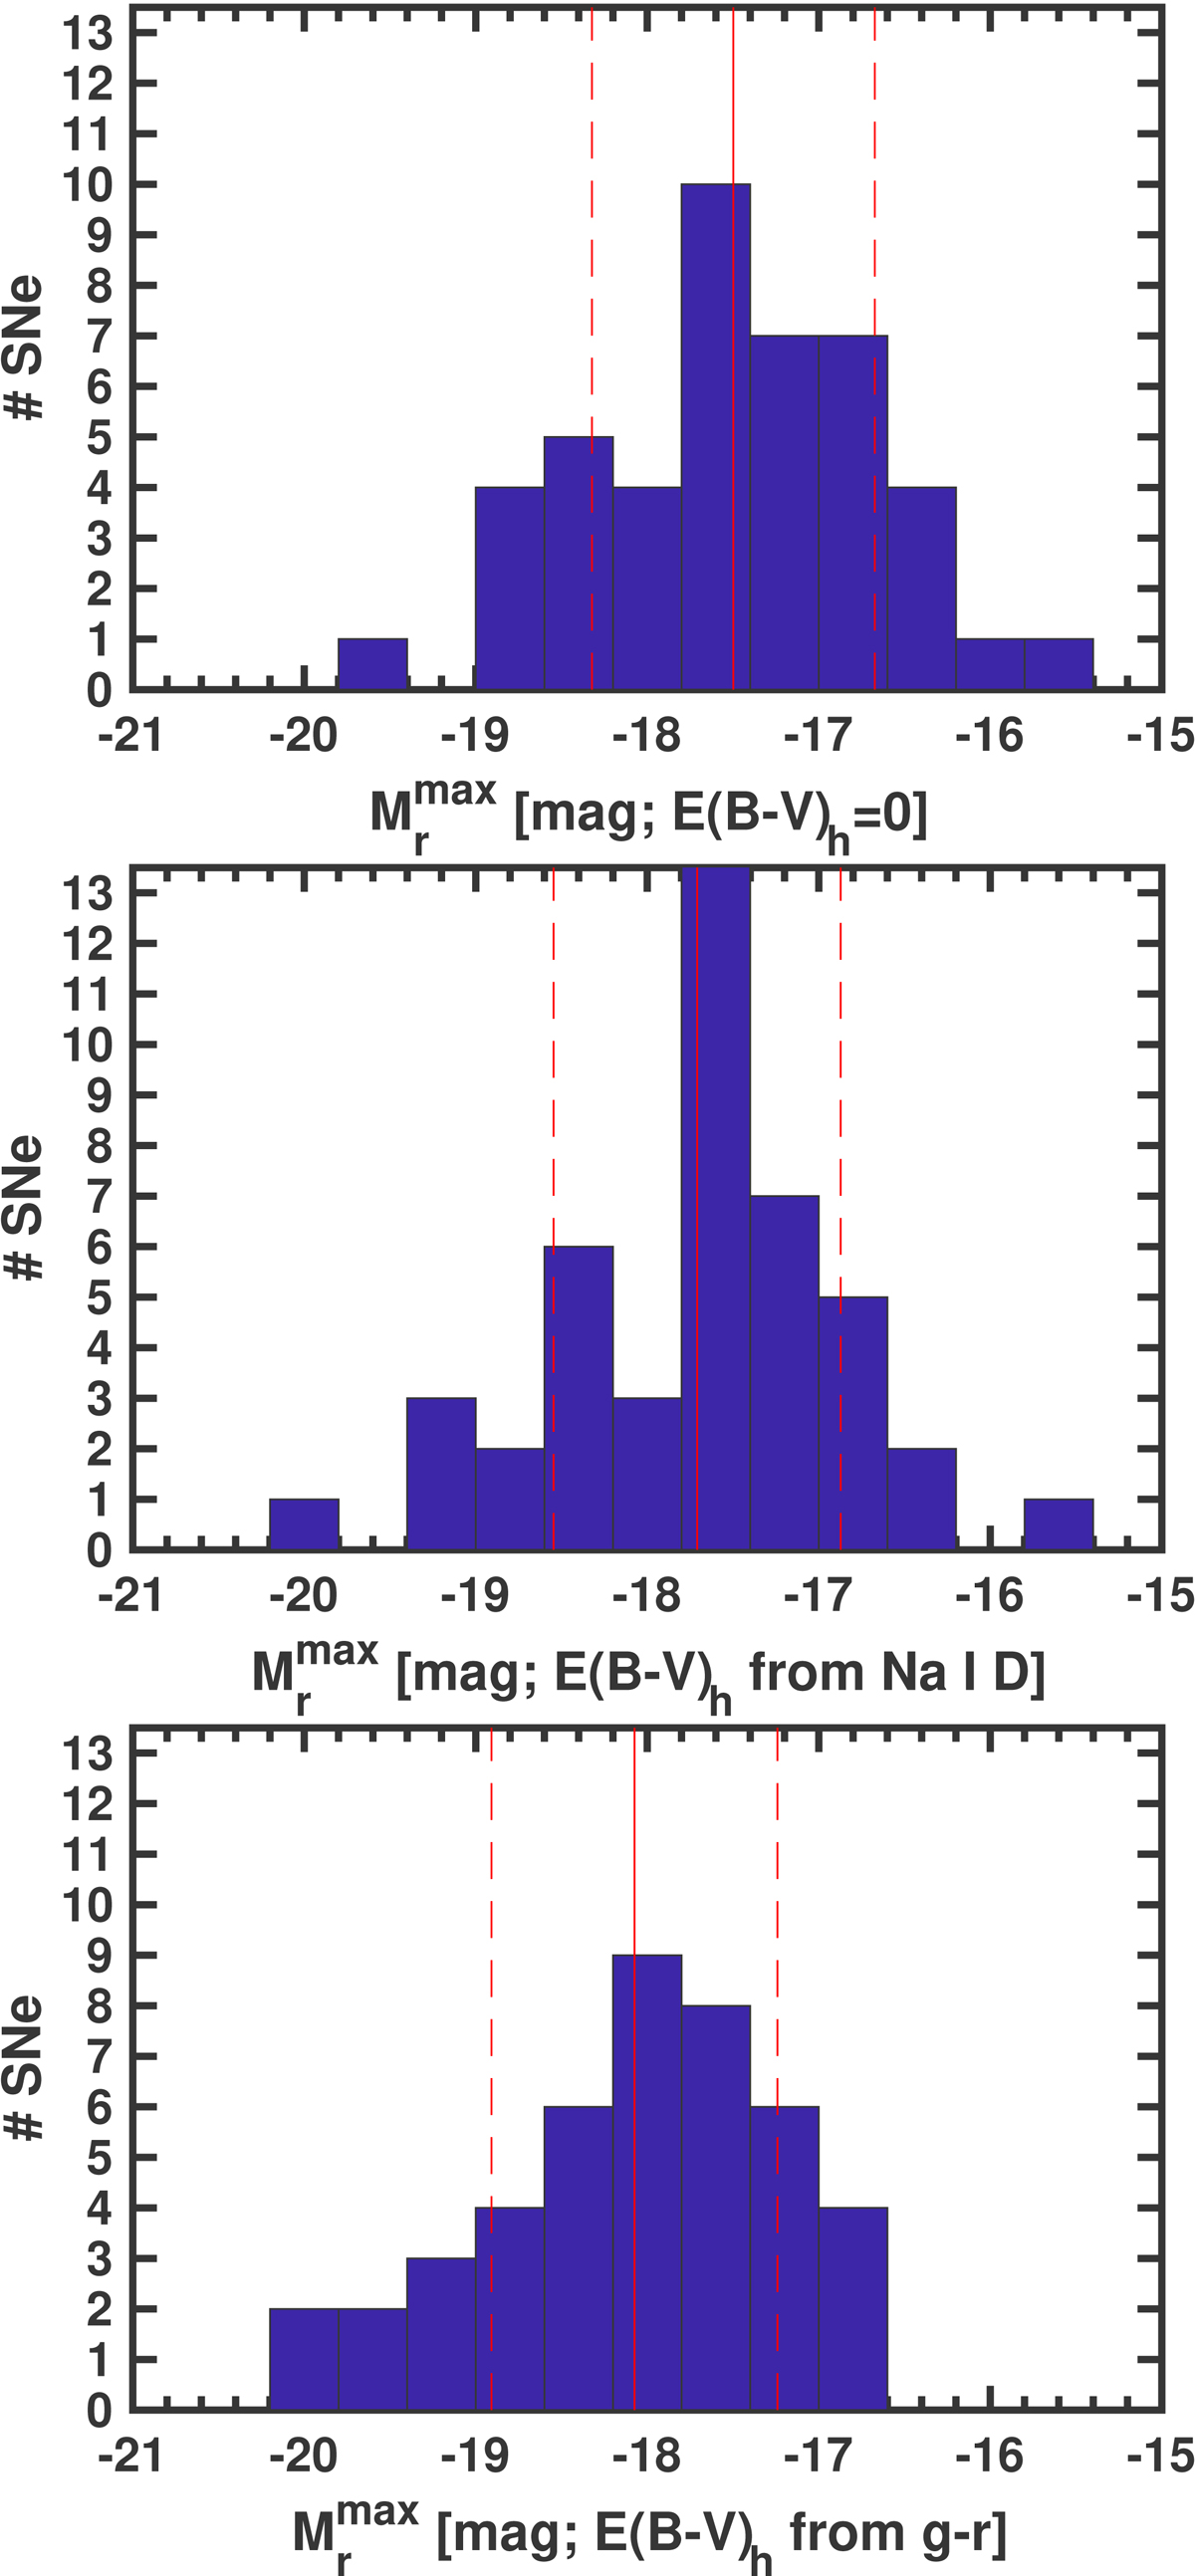
Histogram representation of the absolute magnitudes at peak in the r-band distribution of the sample. Upper panel: distribution obtained correcting for the distance and the MW extinction. Middle panel: distribution obtained including also the extinction from the host galaxy, estimated through the Na I D absorption. Bottom panel: distribution obtained including instead the host extinction from the colors.
Current usage metrics show cumulative count of Article Views (full-text article views including HTML views, PDF and ePub downloads, according to the available data) and Abstracts Views on Vision4Press platform.
Data correspond to usage on the plateform after 2015. The current usage metrics is available 48-96 hours after online publication and is updated daily on week days.
Initial download of the metrics may take a while.