Fig. 4
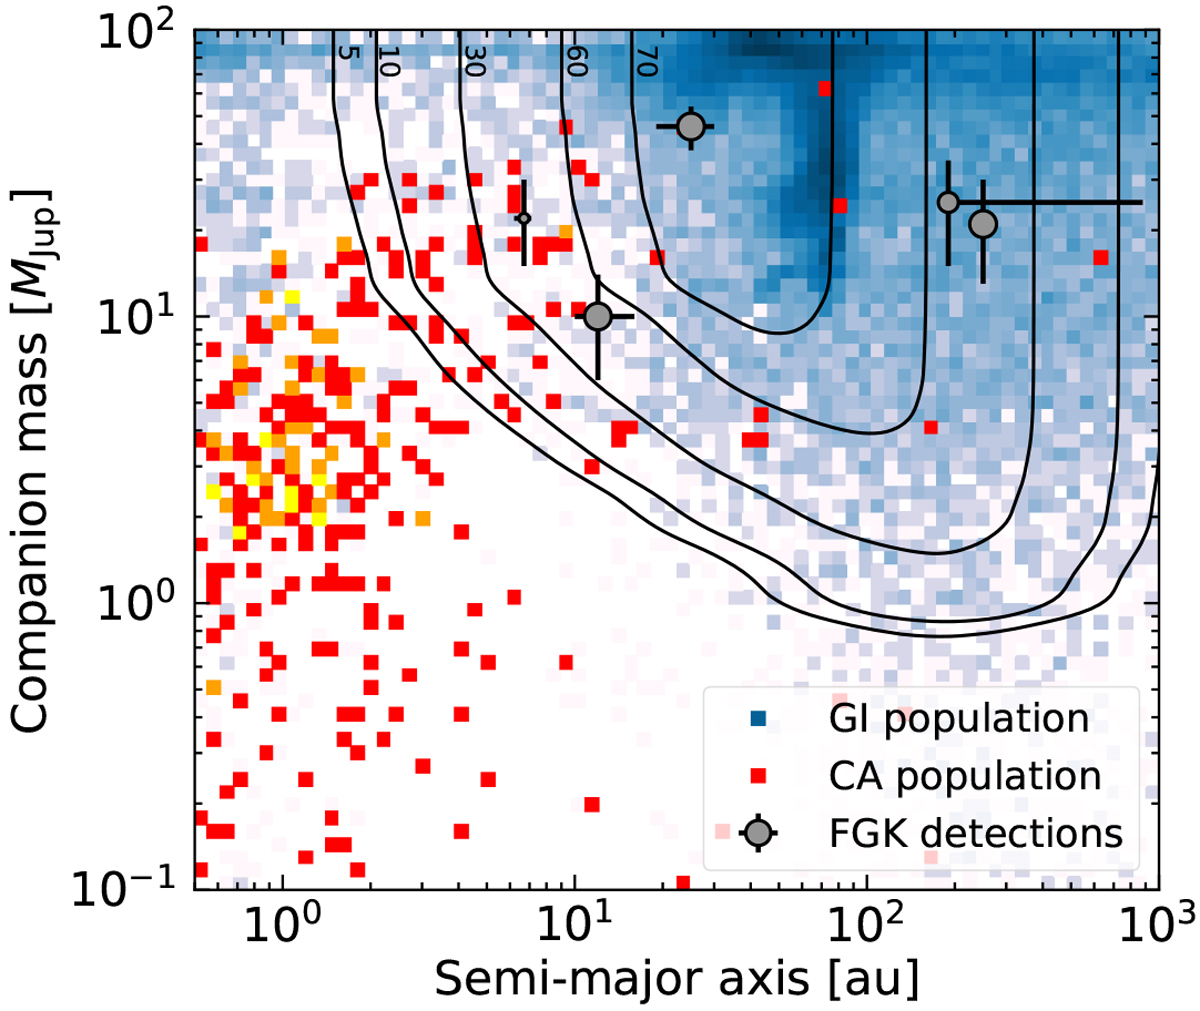
Comparison of the depth of search of the SHINE survey for the 77 FGK stars in the sample with the population synthesis models based on the CA and GI formation scenarios presented in Sects. 3.2.1 and 3.2.2, respectively. The contour lines give the numbers of stars around which the survey is sensitive to substellar companions as a function of mass and semimajor axis. The CA companions are represented with shades of red (low density of companions) to yellow (high density of companions), and the GI companions are represented with shades of white (low density of companions) to blue (high density of companions). The apparent lower density of CA objects arises because the vast majority of the CA population is located outside the range of mass and semimajor axis considered in this plot. Only the detections around FGK stars are plotted.
Current usage metrics show cumulative count of Article Views (full-text article views including HTML views, PDF and ePub downloads, according to the available data) and Abstracts Views on Vision4Press platform.
Data correspond to usage on the plateform after 2015. The current usage metrics is available 48-96 hours after online publication and is updated daily on week days.
Initial download of the metrics may take a while.