Fig. 2
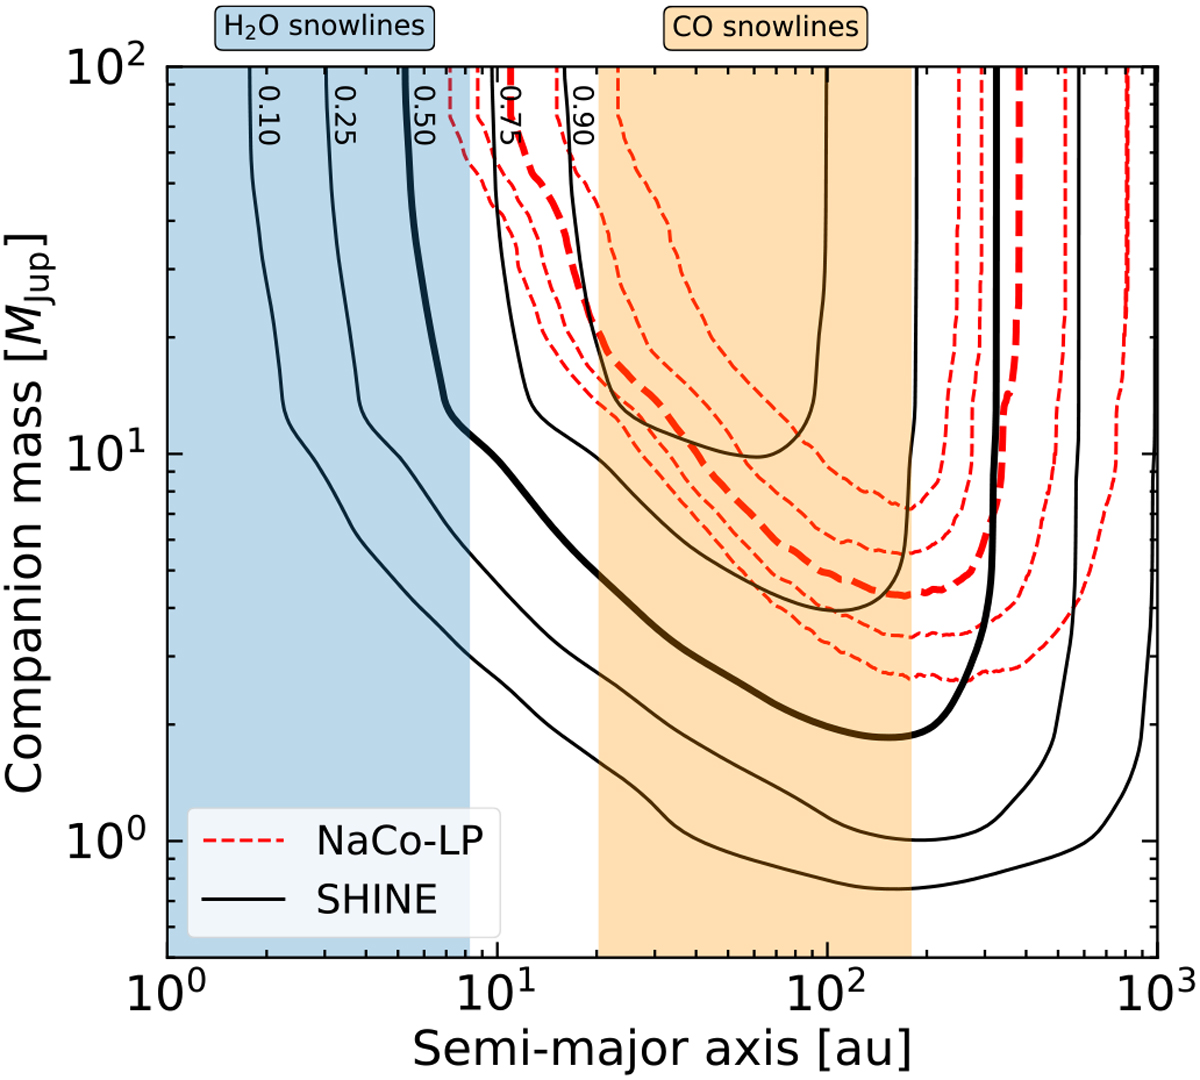
Comparison of the sensitivities of the NaCo-LP (Vigan et al. 2017; dashed red lines) and SHINE (this work; solid black lines) surveys (with the current sample), based on the average probability of detecting a companion as a function of its mass and semimajor axis. The analysis is based on detection limits that were converted using the COND-2003 evolutionary tracks for both surveys. The contours for the NaCo-LP are not labeled but are the same as for SHINE, and correspond to equal levels of detection probability. The range of semimajor axes spanning the H2 O and CO snow lines for the stars in the sample are overplotted (see Sect. 2.6 for details).
Current usage metrics show cumulative count of Article Views (full-text article views including HTML views, PDF and ePub downloads, according to the available data) and Abstracts Views on Vision4Press platform.
Data correspond to usage on the plateform after 2015. The current usage metrics is available 48-96 hours after online publication and is updated daily on week days.
Initial download of the metrics may take a while.