Fig. 7
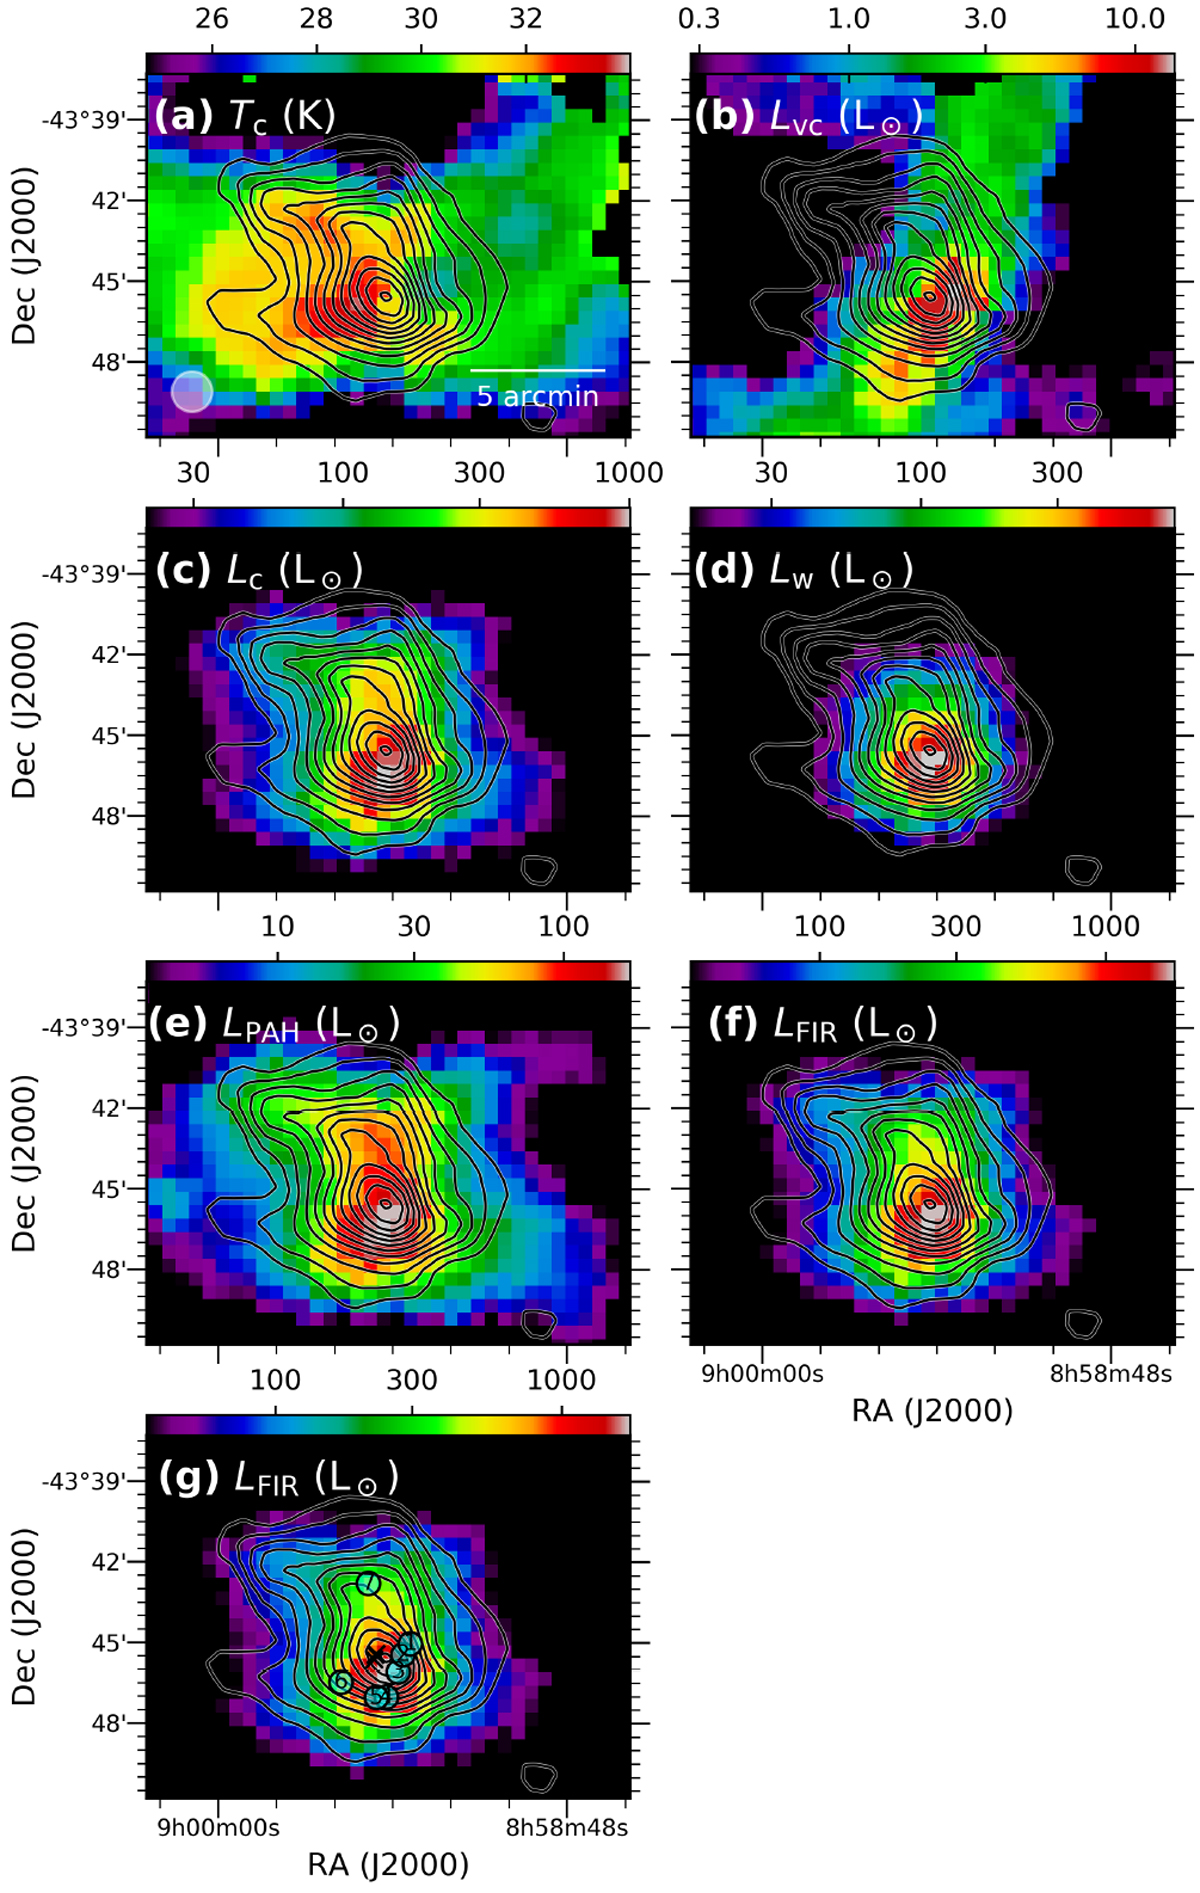
Spatial distributions of (a) cold dust temperature (Tc), (b) very colddust luminosity (Lvc), (c) cold dustluminosity (Lc), (d) warm dust luminosity (Lw), (e) PAH luminosity (LPAH), and (f) far-IR luminosity (LFIR = Lvc + Lc + Lw). The panel g is same asthe panel f, but the positions of seven clumps and OB stars are denoted by circles and crosses, respectively (Ellerbroek et al. 2013; Minier et al. 2013). Dust temperature and luminosity are in units of kelvin and solar luminosity, respectively. For each luminosity map, the colour scale ranges from 2 to 98% of the peak luminosity. The contours superimposed on the images are the same as those in Fig. 2.
Current usage metrics show cumulative count of Article Views (full-text article views including HTML views, PDF and ePub downloads, according to the available data) and Abstracts Views on Vision4Press platform.
Data correspond to usage on the plateform after 2015. The current usage metrics is available 48-96 hours after online publication and is updated daily on week days.
Initial download of the metrics may take a while.