Fig. 5
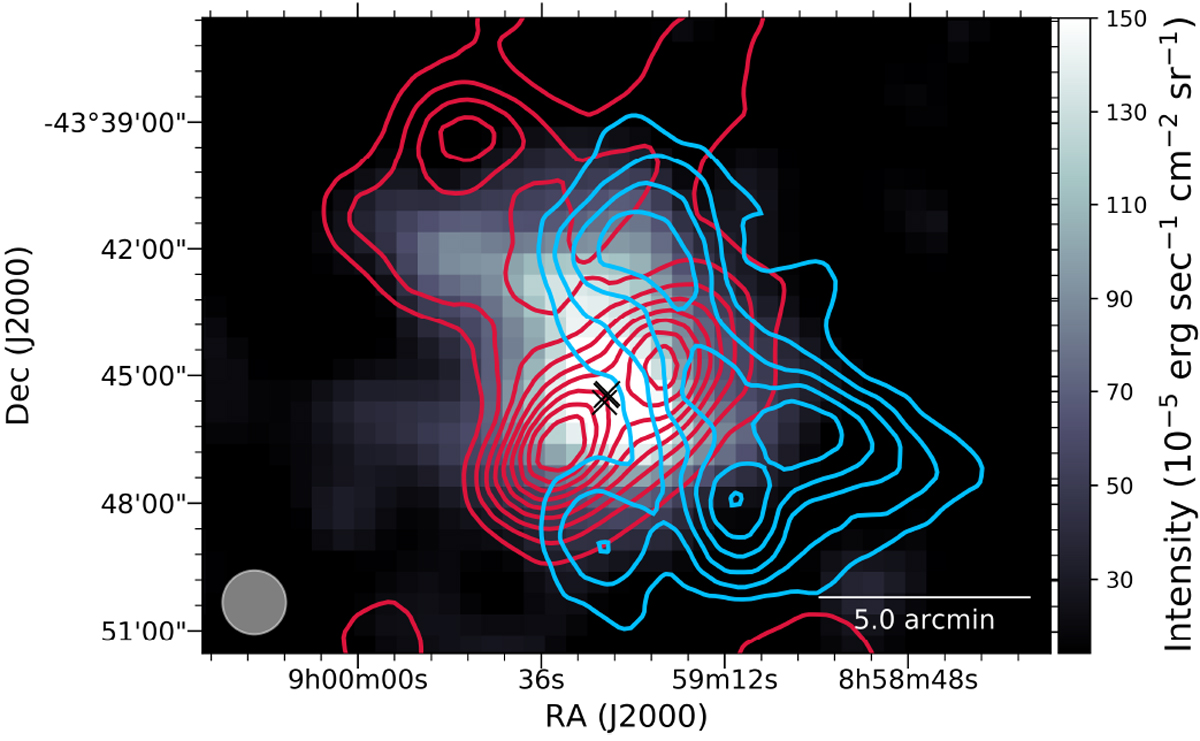
Same as Fig. 2, but 12CO(J = 2–1) contours (Fig. 4a in Sano et al. 2018) and positions of OB stars (cross) (Ellerbroek et al. 2013). The cyan and red coloured contours represent two-velocity molecular cloud components with VLSR = 4.1–6.1 km s−1 (blue cloud) and 7.6–12.0 km s−1 (red cloud), respectively. The spatial resolution of the 12CO(J = 2–1) map taken by NANTEN2 is similar to the [C II] map (90′′).
Current usage metrics show cumulative count of Article Views (full-text article views including HTML views, PDF and ePub downloads, according to the available data) and Abstracts Views on Vision4Press platform.
Data correspond to usage on the plateform after 2015. The current usage metrics is available 48-96 hours after online publication and is updated daily on week days.
Initial download of the metrics may take a while.