Fig. 3.
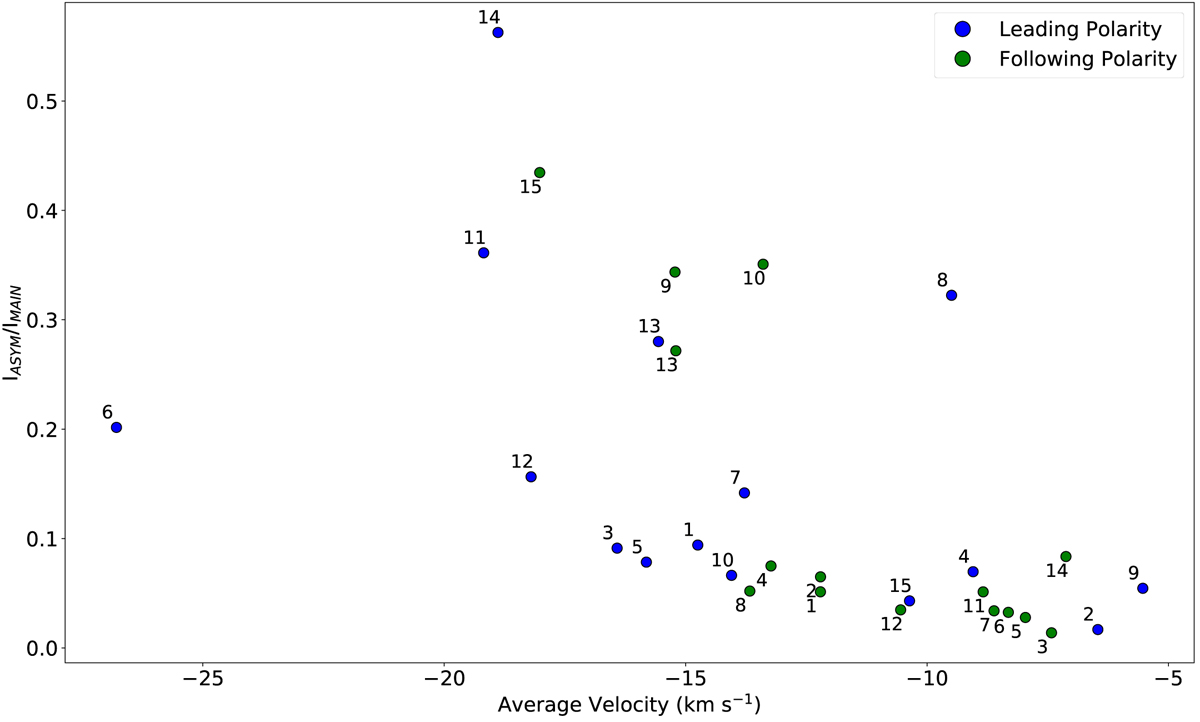
Intensity ratio of the asymmetric and main component Gaussians as a function of the average velocities calculated for the regions of interest located in the eastern and western upflows of each AR. The blue (green) circles represent the average velocities associated with the leading (following) polarity of the AR. The numbers correspond to the EIS scans of the ARs given in Table 1.
Current usage metrics show cumulative count of Article Views (full-text article views including HTML views, PDF and ePub downloads, according to the available data) and Abstracts Views on Vision4Press platform.
Data correspond to usage on the plateform after 2015. The current usage metrics is available 48-96 hours after online publication and is updated daily on week days.
Initial download of the metrics may take a while.