Fig. 1.
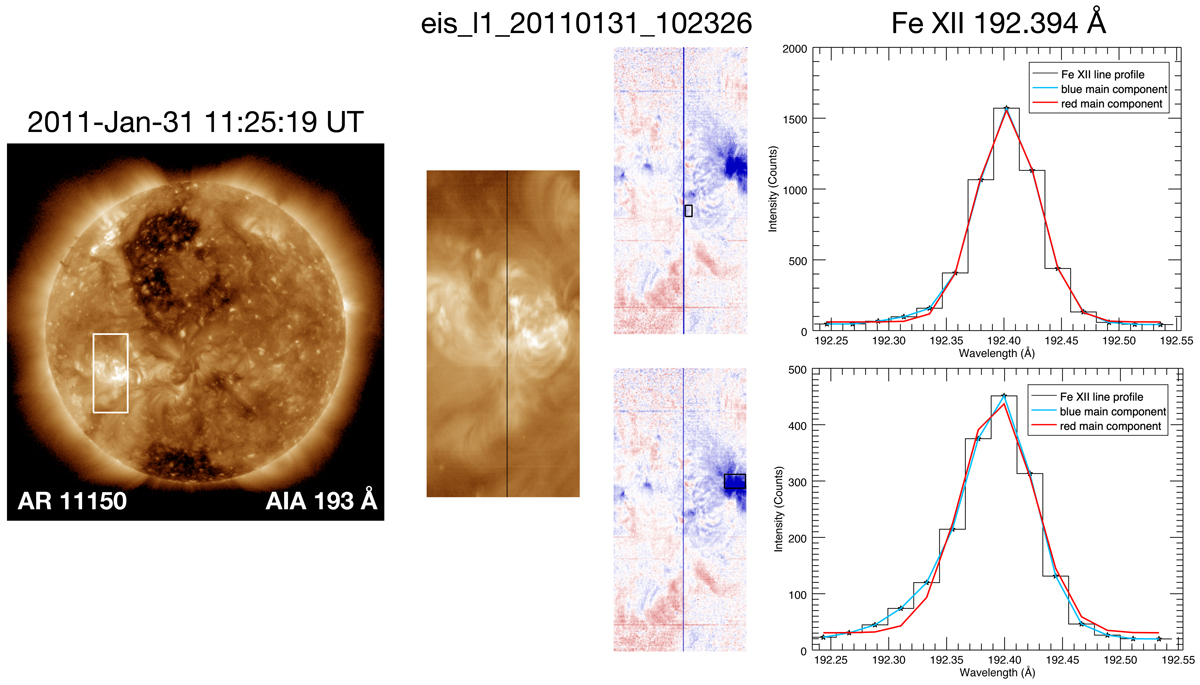
Blue wing asymmetries for the eastern and western upflows of NOAA AR 11150 (No. 6 in Table 1). Left panel: 193 Å image taken by the Solar Dynamics Observatory/Atmospheric Imaging Assembly (SDO/AIA), with the white box corresponding to the EIS field-of-view. Middle panel: EIS Fe XII 192.394 Å image and Doppler velocity maps. Final panel: mean spectrum of the pixels highlighted by the black boxes in the EIS scans (middle panel), fitted with a single Gaussian.
Current usage metrics show cumulative count of Article Views (full-text article views including HTML views, PDF and ePub downloads, according to the available data) and Abstracts Views on Vision4Press platform.
Data correspond to usage on the plateform after 2015. The current usage metrics is available 48-96 hours after online publication and is updated daily on week days.
Initial download of the metrics may take a while.