Fig. 6
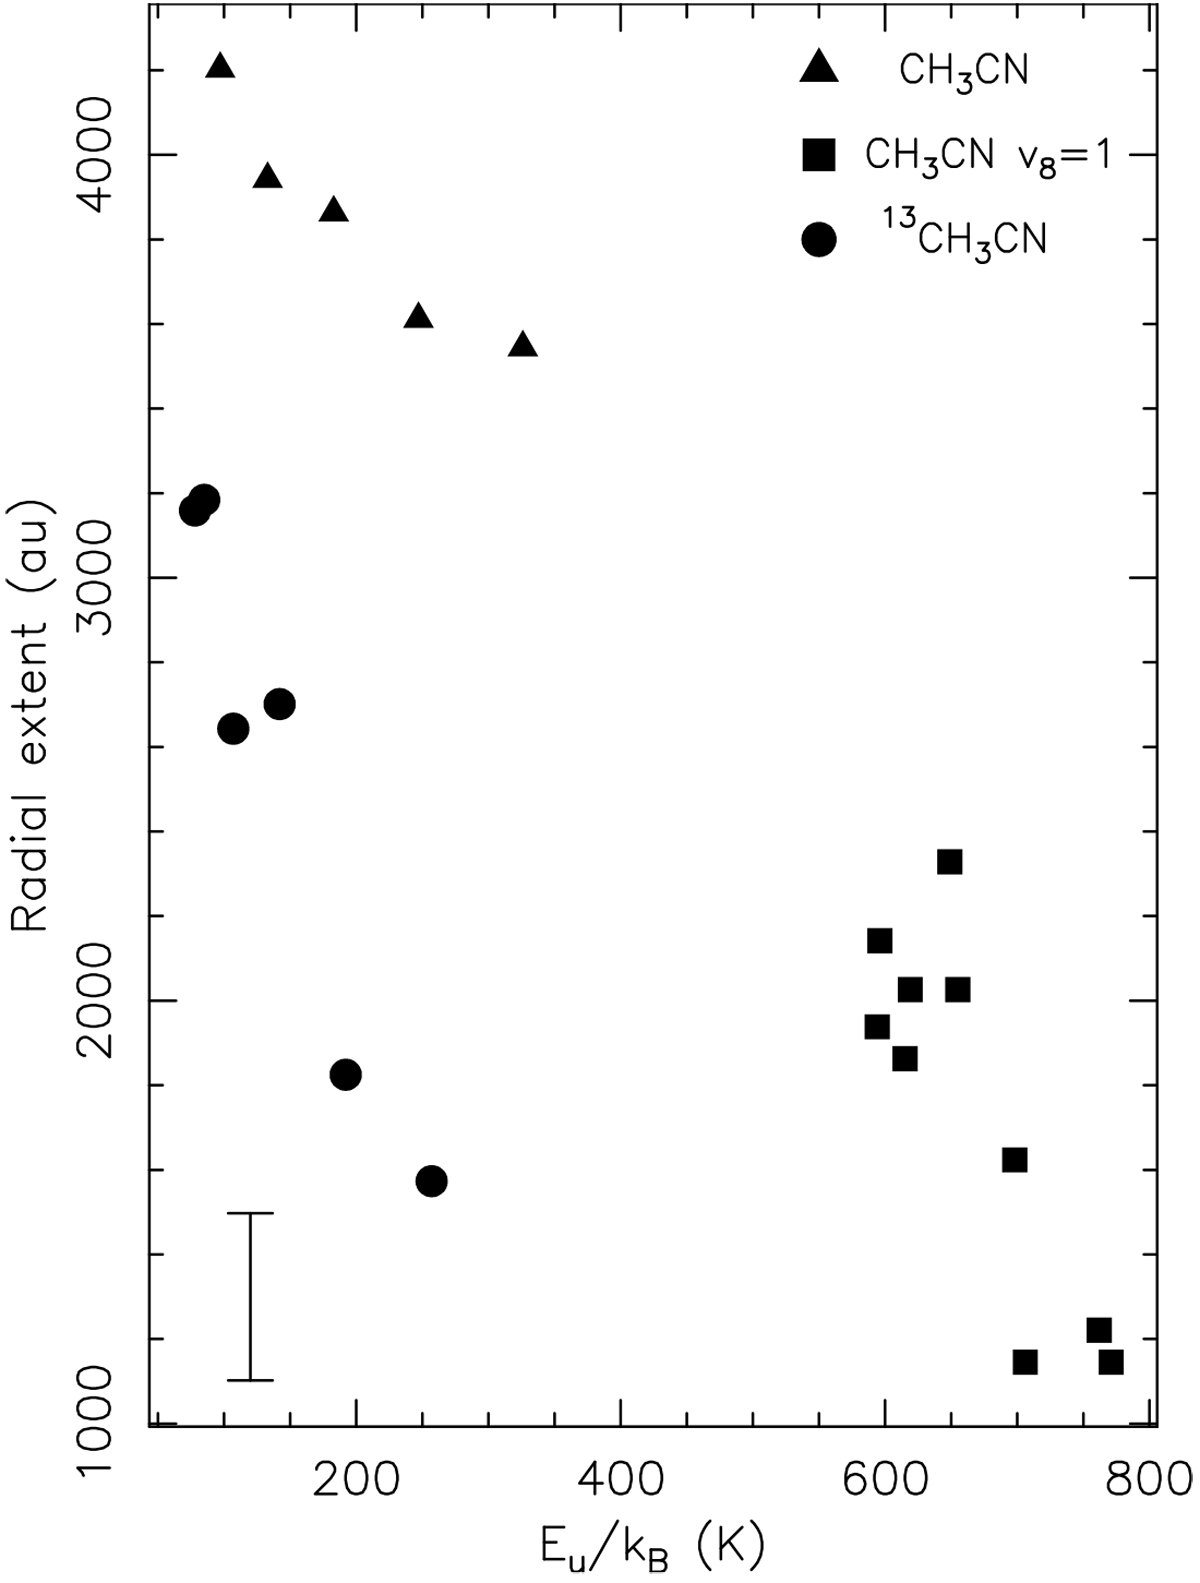
ALMA 2019 data: plot of the radial extent of the velocity profile vs. the energy of the upper level of the transition for the molecular lines listed in Table 1. Triangles, squares, and circles refer to transitions of CH3CN, CH3CN v8 = 1, and 13CH3CN, respectively.The error bar in the lower left corner indicates the spatial resolution.
Current usage metrics show cumulative count of Article Views (full-text article views including HTML views, PDF and ePub downloads, according to the available data) and Abstracts Views on Vision4Press platform.
Data correspond to usage on the plateform after 2015. The current usage metrics is available 48-96 hours after online publication and is updated daily on week days.
Initial download of the metrics may take a while.