Fig. 5
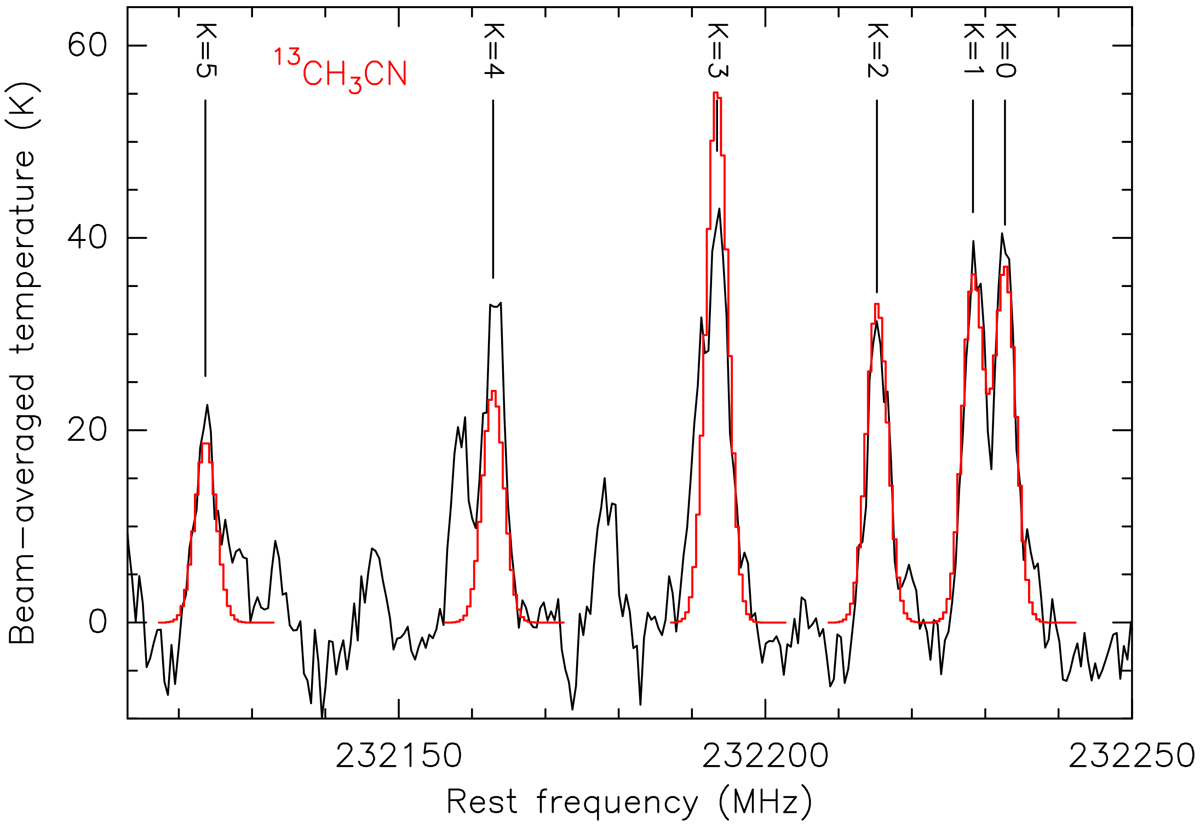
ALMA 2019 data: observed spectrum (black line) of SPW 6 across a frequency range covering the 13CH3CN JK = 13K–12K, K = 0–5, lines. The emission is averaged over a circle of 0.′′1 radius toward the center of the HC H II region. The fit (red histogram) of the 13CH3CN JK = 13K–12K, K = 0–5, lines performed with XCLASS is also reported.
Current usage metrics show cumulative count of Article Views (full-text article views including HTML views, PDF and ePub downloads, according to the available data) and Abstracts Views on Vision4Press platform.
Data correspond to usage on the plateform after 2015. The current usage metrics is available 48-96 hours after online publication and is updated daily on week days.
Initial download of the metrics may take a while.