Fig. 4
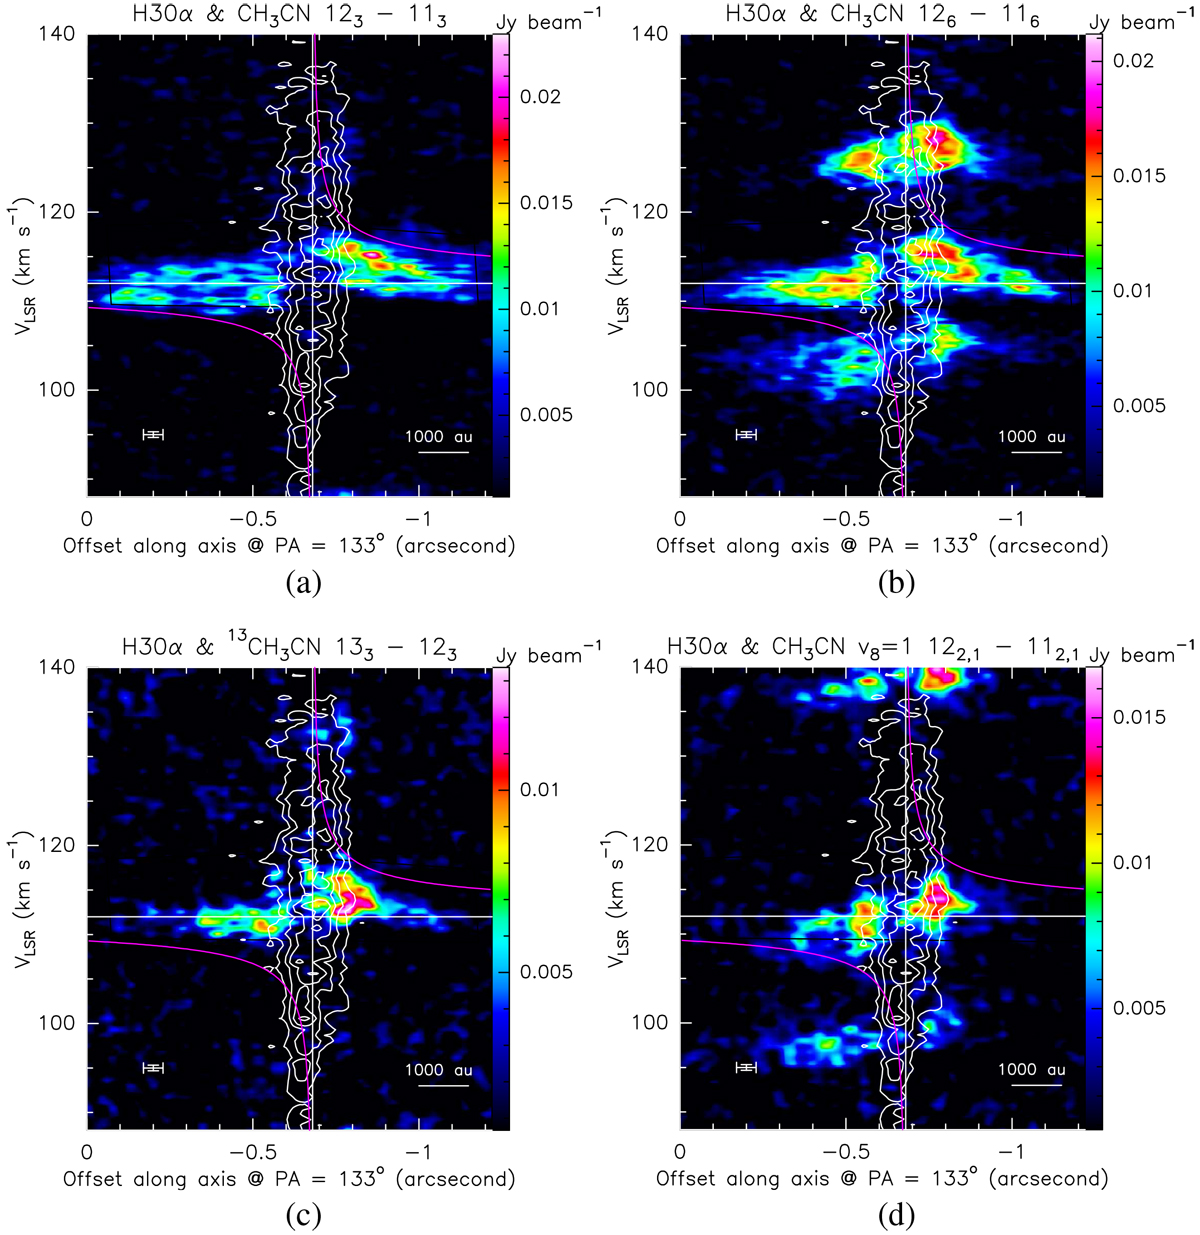
ALMA 2019 data. Each panel presents the combined PV plots, along the cut at PA = 133°, of the H30α emission (white contours; same as Fig. 3, lower panel) and a selected molecular line (color map): CH3CN JK = 123–113 (a); CH3CN JK = 126 –116 (b); 13CH3CN JK = 133–123 (c); and CH3CN v8 = 1 JK,l = 122,1–112,1 (d). Panels b and d: emission of other transitions close in frequency to the selected line. In each panel, the vertical and horizontal white axes denote the positional offset (≈ −0.′′68) and VLSR (≈112 km s−1) of the YSO, respectively. The magenta curve shows the Keplerian velocity profile for a central mass of 20 M⊙. In the lower left corner, the vertical and horizontal white error bars indicate the velocity and spatial resolutions, respectively.
Current usage metrics show cumulative count of Article Views (full-text article views including HTML views, PDF and ePub downloads, according to the available data) and Abstracts Views on Vision4Press platform.
Data correspond to usage on the plateform after 2015. The current usage metrics is available 48-96 hours after online publication and is updated daily on week days.
Initial download of the metrics may take a while.