Fig. 3
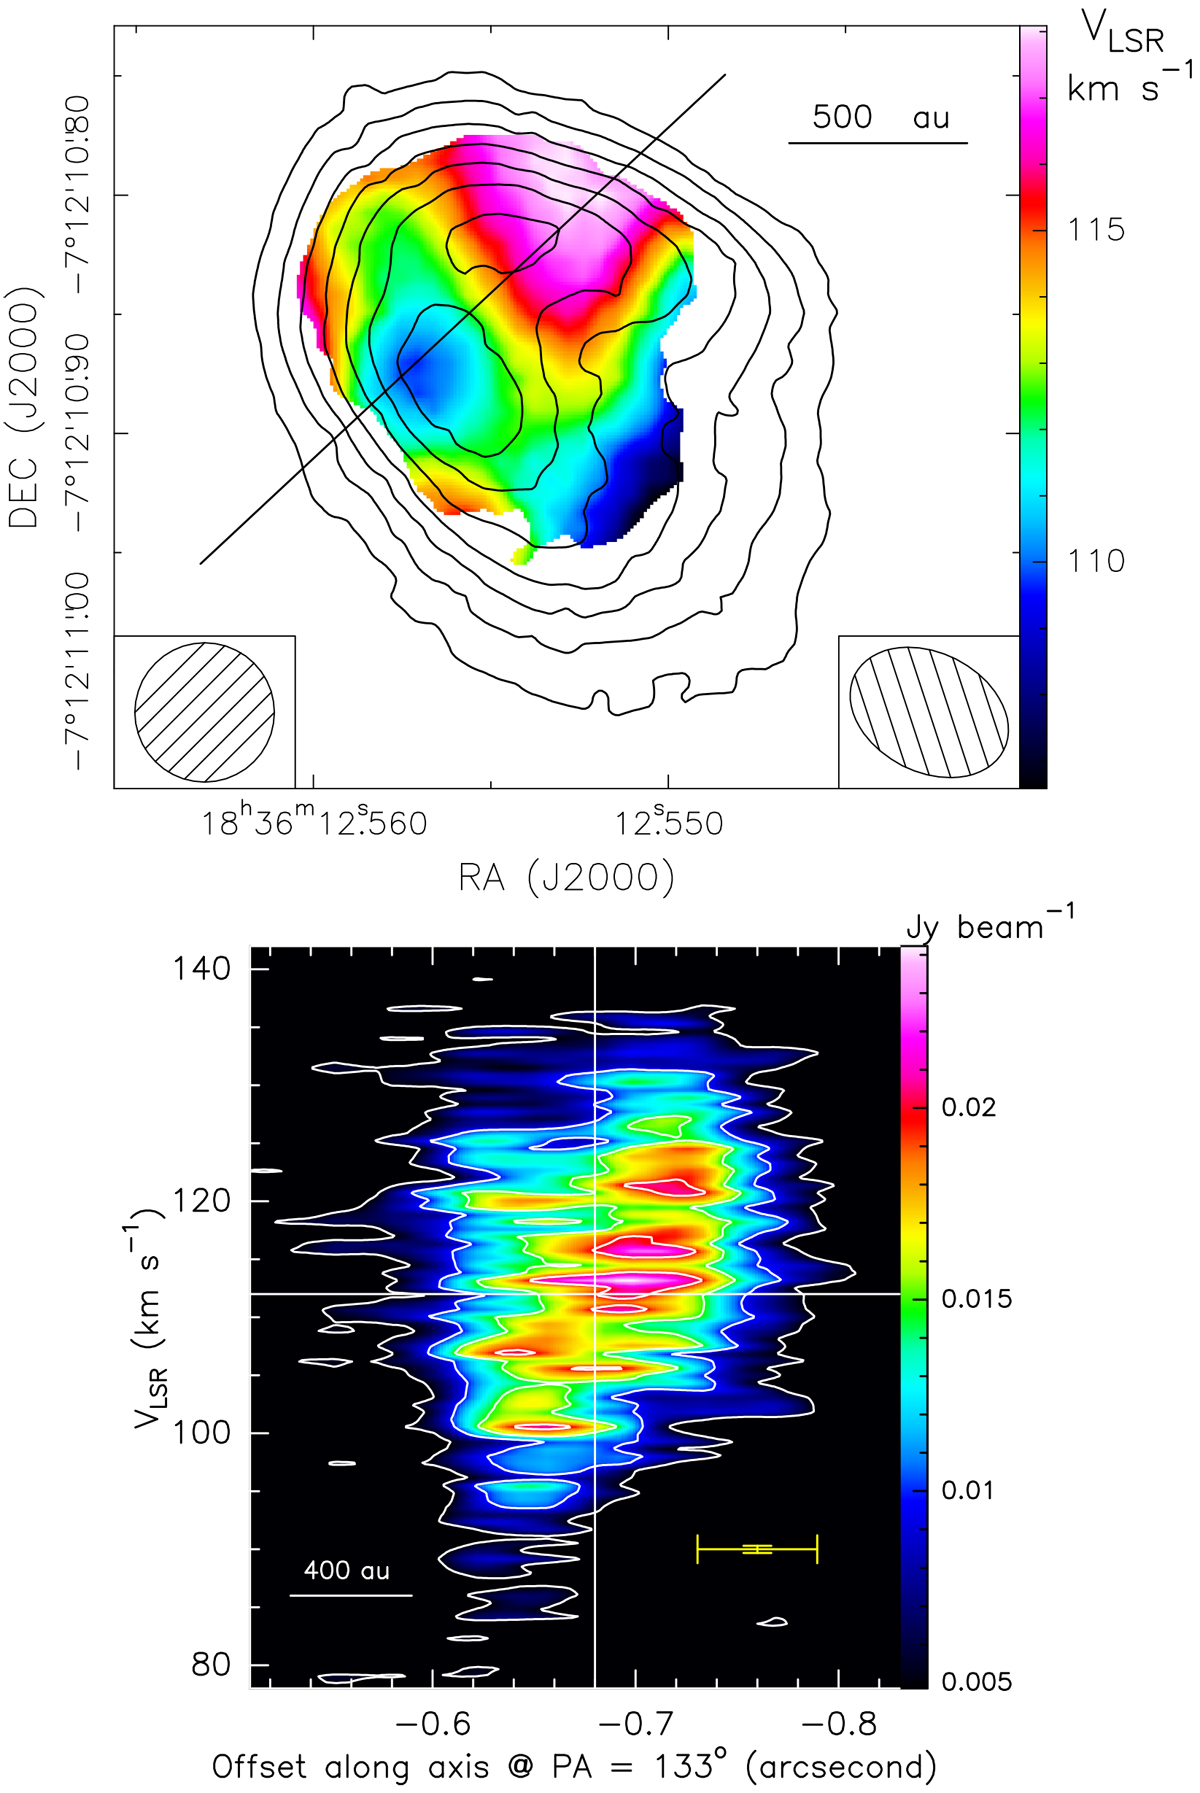
ALMA 2019 data. Upper panel: intensity-weighted velocity (color map) of the H30α emission, obtained from averaging the channel maps produced by weighting the uv -data with the “Briggs” robust parameter set to 0.5. The circular restoring beam has a FWHM size (0.′′ 058) equal to the geometric mean of the FWHM major and minor sizes of the Briggs beam and is shown in the lower left corner. The straight line indicates the direction, at PA = 133°, that connects the pixels of maximum and minimum velocity. The ALMA 1.4 mm continuum is represented with black contours, ranging from 3.2 to 10.6 in steps of 1.1 mJy beam−1. The beam of the continuum map is reported in the lower right corner. Lower panel: color map and white contours showing the PV plot of the H30α line along the cut at PA = 133°. The contour levels range from 4.9 to 24.6 in steps of 4.9 mJy beam−1. The vertical and horizontal white axes denote the positional offset (≈ −0.′′68) and VLSR (≈112 km s−1) of the YSO, respectively. In the lower right corner, the vertical and horizontal yellow error bars indicate the velocity and spatial resolutions, respectively.
Current usage metrics show cumulative count of Article Views (full-text article views including HTML views, PDF and ePub downloads, according to the available data) and Abstracts Views on Vision4Press platform.
Data correspond to usage on the plateform after 2015. The current usage metrics is available 48-96 hours after online publication and is updated daily on week days.
Initial download of the metrics may take a while.