Fig. 2
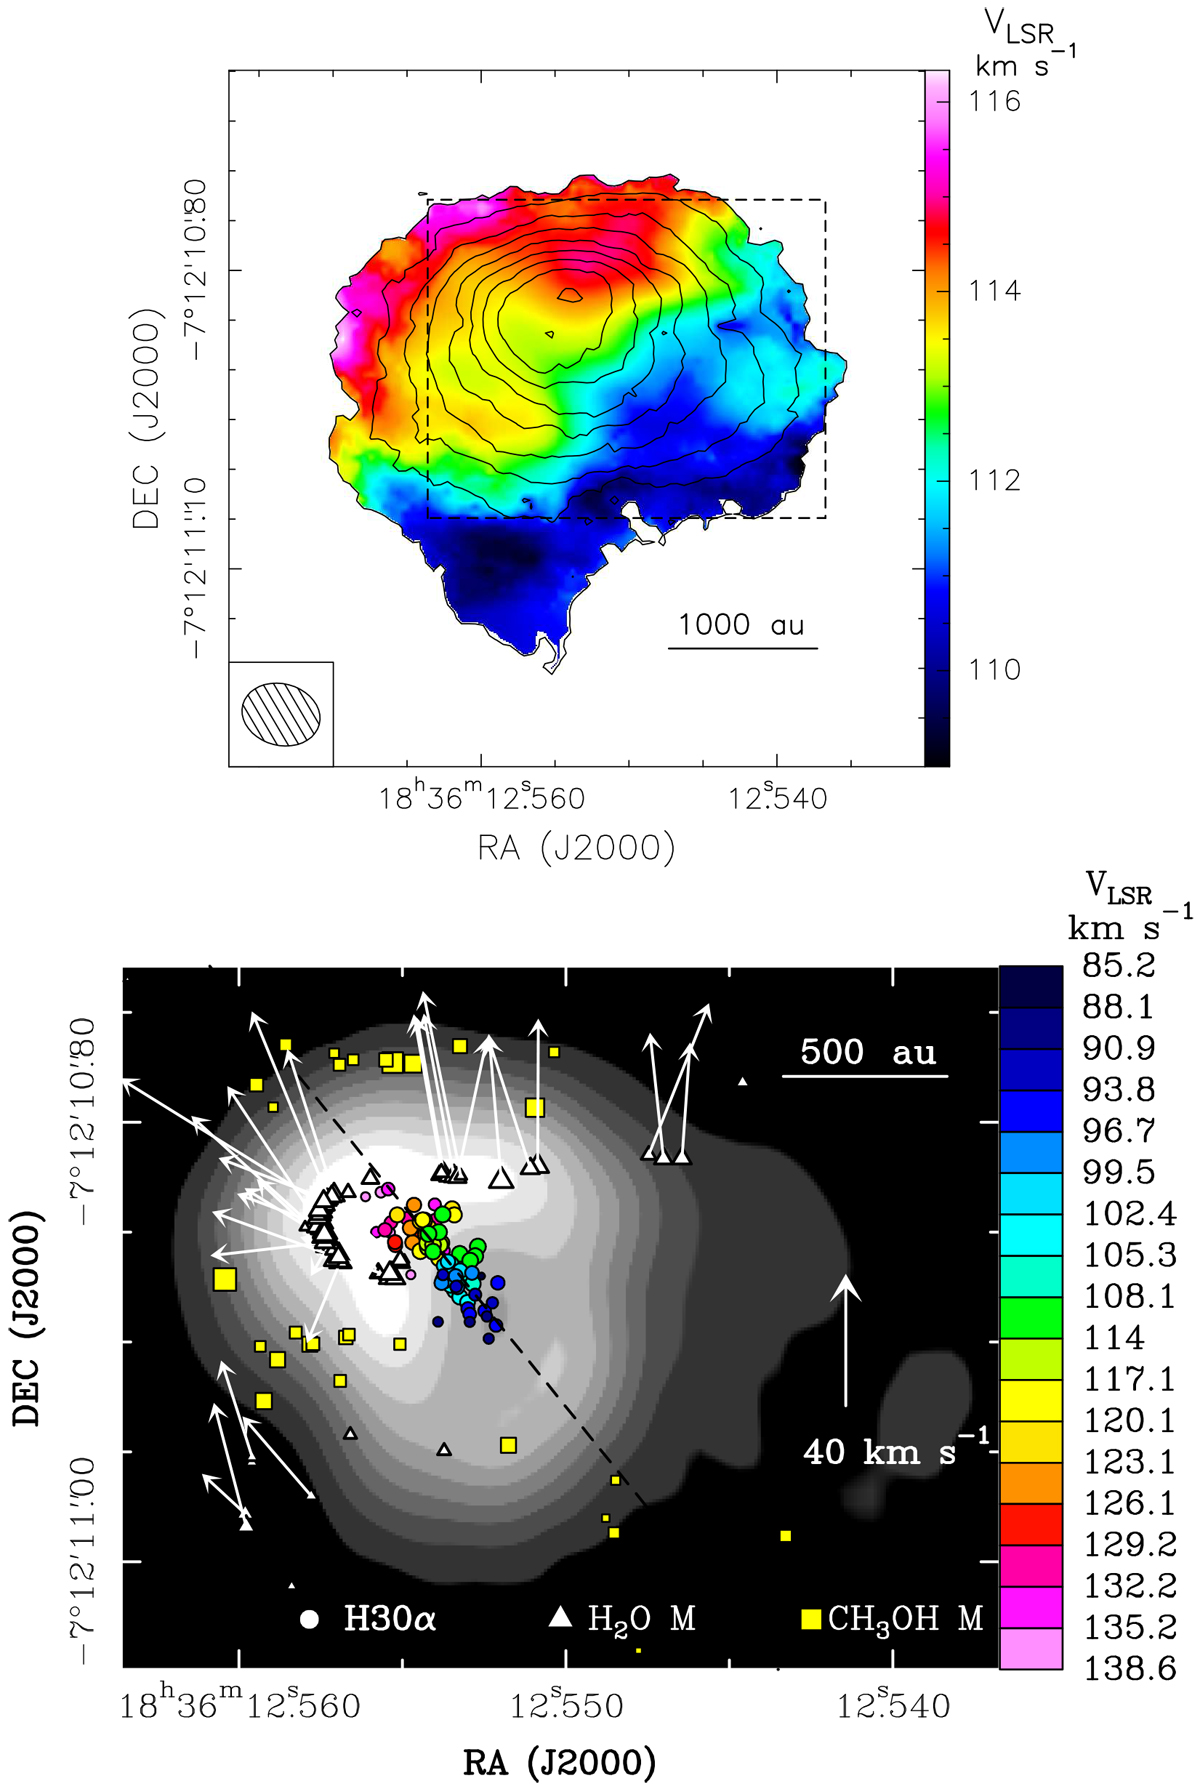
HC H II region. Upper panel: ALMA 2019 data: intensity-weighted velocity (color map) of the H30α emission, obtained from averaging the channel maps produced with a natural weighting of the uv -data. The beam (FWHM 0.′′080 × 0.′′062, with PA = 75°) is shown in the lower left corner. The black contours represent the velocity-integrated intensity of the H30α line, showinglevels from 0.26 to 1.3 in steps of 0.13 Jy beam−1 km s−1. The dashedblack rectangle delimits the field of view shown in the lower panel. Lower panel: ALMA 2015, VLA, and Very Long Baseline Interferometry (VLBI) data. The grayscale image represents the VLA A-Array 7 mm continuum observed by Beltrán et al. (2007). The white triangles and yellow squares mark the VLBI positions of the H2O 22 GHz (Moscadelli et al. 2007) and CH3OH 6.7 GHz masers (Moscadelli et al. 2018), respectively; the area of the symbol is proportional to the logarithm of the maser intensity. The white arrows show the proper motions of the H2O masers, which were first reported and analyzed in Moscadelli et al. (2007). The colored dots give the channel peak positions of the H30α line emissionobtained by Moscadelli et al. (2018) from ALMA data with 0.′′2 resolution; the colors denote the VLSR as indicated to the right of the plot. The dashed black line marks the axis of the spatial distribution of the H30α peaks.
Current usage metrics show cumulative count of Article Views (full-text article views including HTML views, PDF and ePub downloads, according to the available data) and Abstracts Views on Vision4Press platform.
Data correspond to usage on the plateform after 2015. The current usage metrics is available 48-96 hours after online publication and is updated daily on week days.
Initial download of the metrics may take a while.