Fig. 1
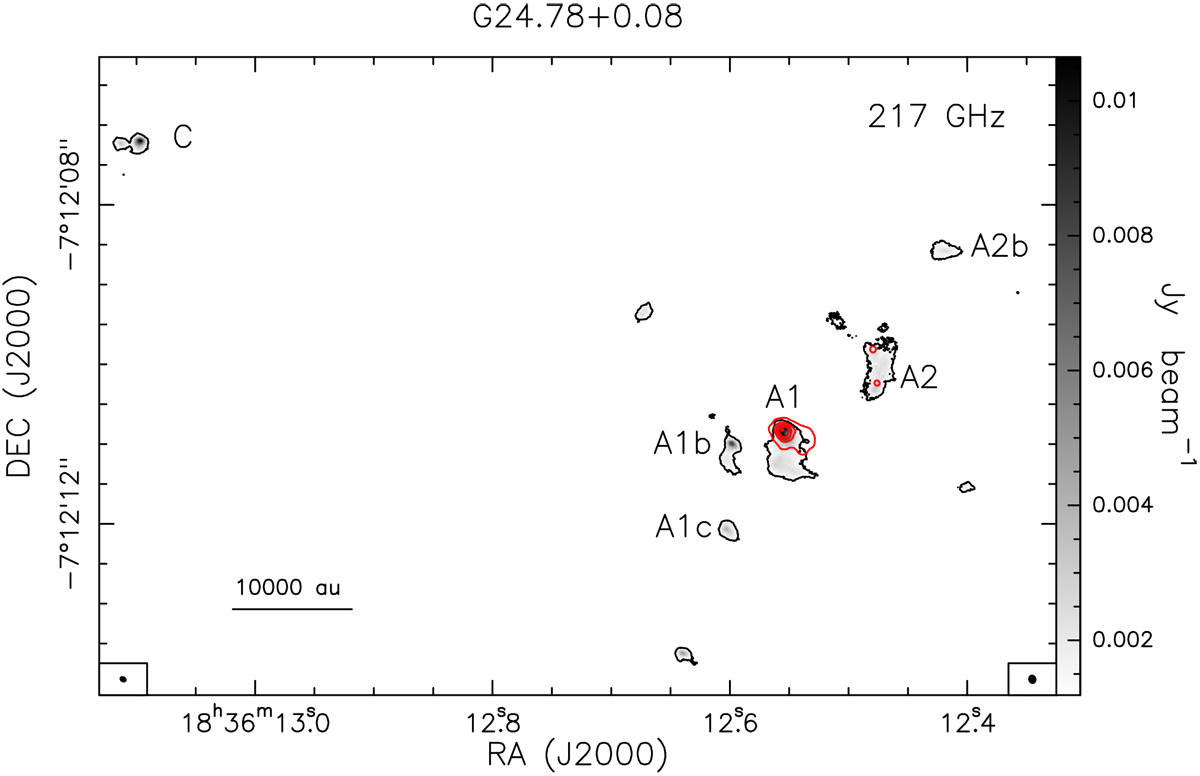
ALMA 2015 and JVLA observations of the high-mass star-forming region G24.78+0.08. The grayscale image shows the ALMA 1.4 mm continuum, with the intensity scale shown to the right of the panel. The black contour is the 7σ threshold of 1.2 mJy beam−1. The continuum emission fragments into distinct cores, labeled following Beltrán et al. (2011). The red contours reproduce the JVLA A-Array 1.3 cm continuum observed by Moscadelli et al. (2018), plotting levels from 0.3 to 16.3 in steps of 4 mJy beam−1. The insets in the lower left and right corners of the plot show the ALMA and JVLA beams, respectively.
Current usage metrics show cumulative count of Article Views (full-text article views including HTML views, PDF and ePub downloads, according to the available data) and Abstracts Views on Vision4Press platform.
Data correspond to usage on the plateform after 2015. The current usage metrics is available 48-96 hours after online publication and is updated daily on week days.
Initial download of the metrics may take a while.