Free Access
Fig. 9
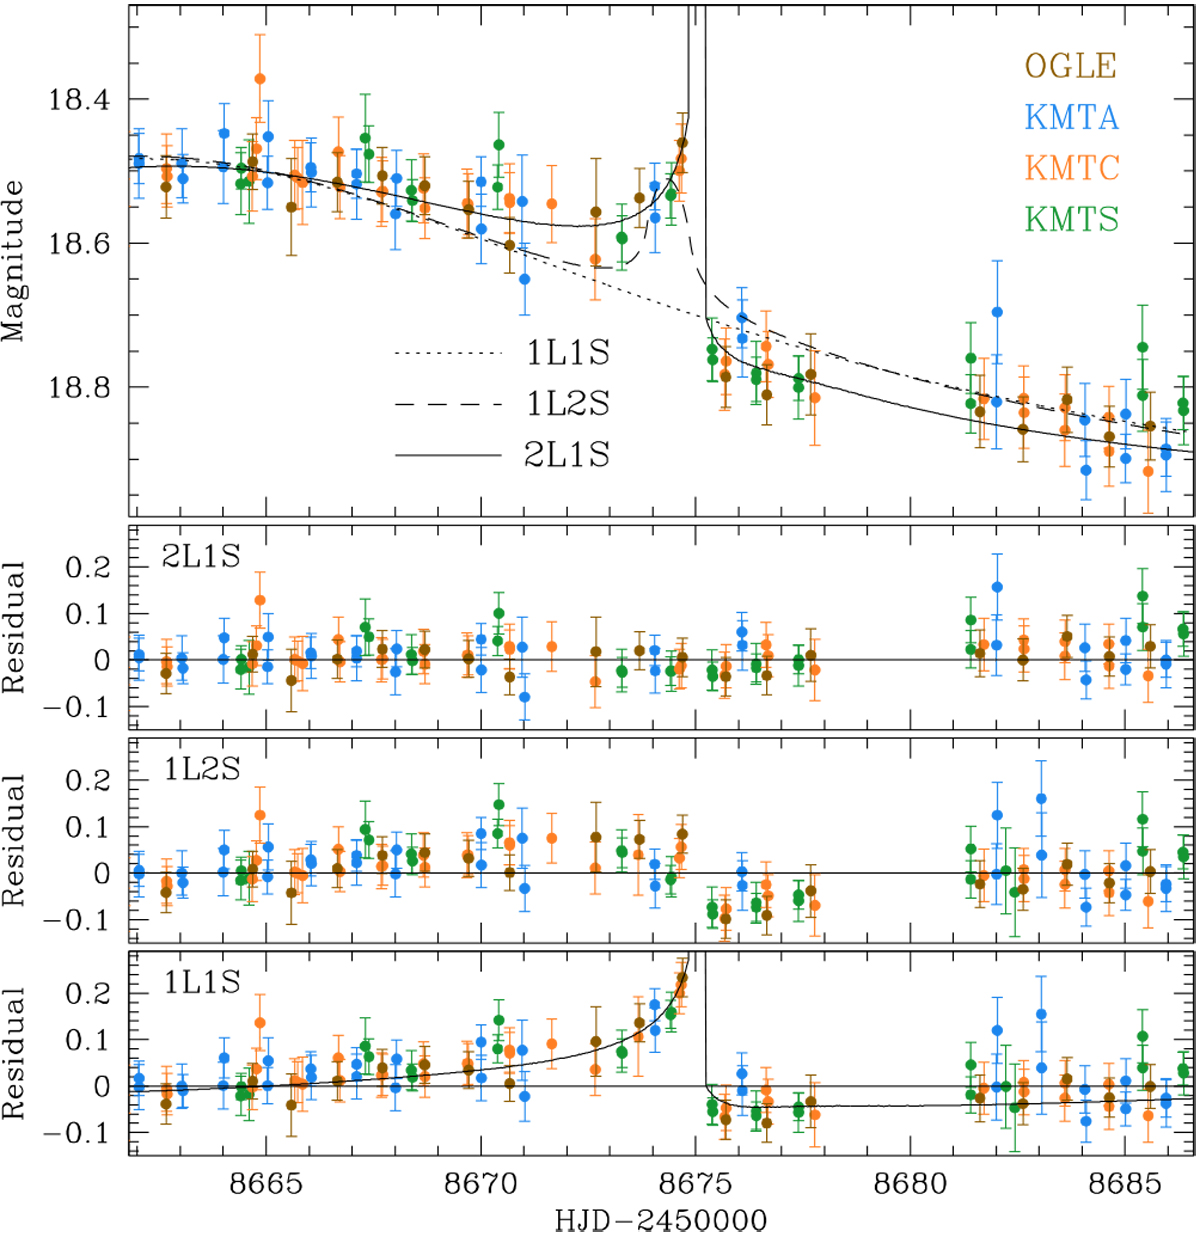
Model curves and residuals of the 1L1S, 1L2S, and 2L1S solutions in the region around the anomaly of OGLE-2019-BLG-0954. Notations are the same as those in Fig. 2, except that the range of the residuals, −0.15–0.29 in magnitudes, is asymmetric to better show the residual from the 1L1S model.
Current usage metrics show cumulative count of Article Views (full-text article views including HTML views, PDF and ePub downloads, according to the available data) and Abstracts Views on Vision4Press platform.
Data correspond to usage on the plateform after 2015. The current usage metrics is available 48-96 hours after online publication and is updated daily on week days.
Initial download of the metrics may take a while.