Fig. 2
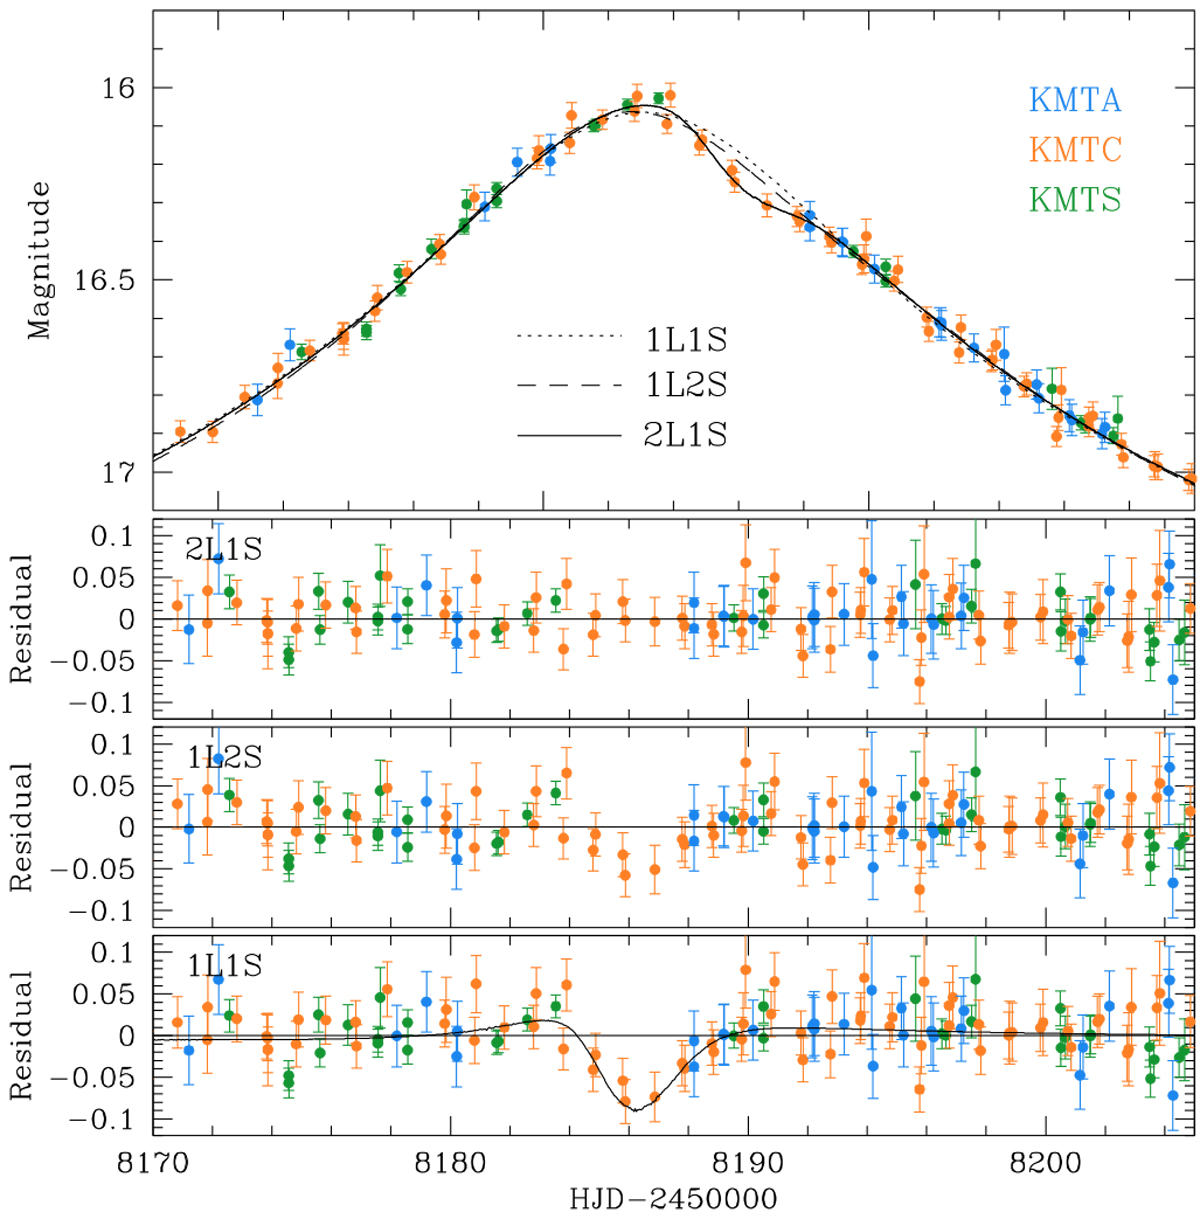
Enlarged view in the peak region of the KMT-2018-BLG-1976 light curve. The three lower panels show the residuals from the three tested models under 1L1S, 1L2S, and 2L1S interpretations. The 2L1S model is based on the wide binary-lens interpretation. The curve drawn in the 1L1S residual panel is the difference between the 2L1S and 1L1S models.
Current usage metrics show cumulative count of Article Views (full-text article views including HTML views, PDF and ePub downloads, according to the available data) and Abstracts Views on Vision4Press platform.
Data correspond to usage on the plateform after 2015. The current usage metrics is available 48-96 hours after online publication and is updated daily on week days.
Initial download of the metrics may take a while.