Free Access
Fig. 11
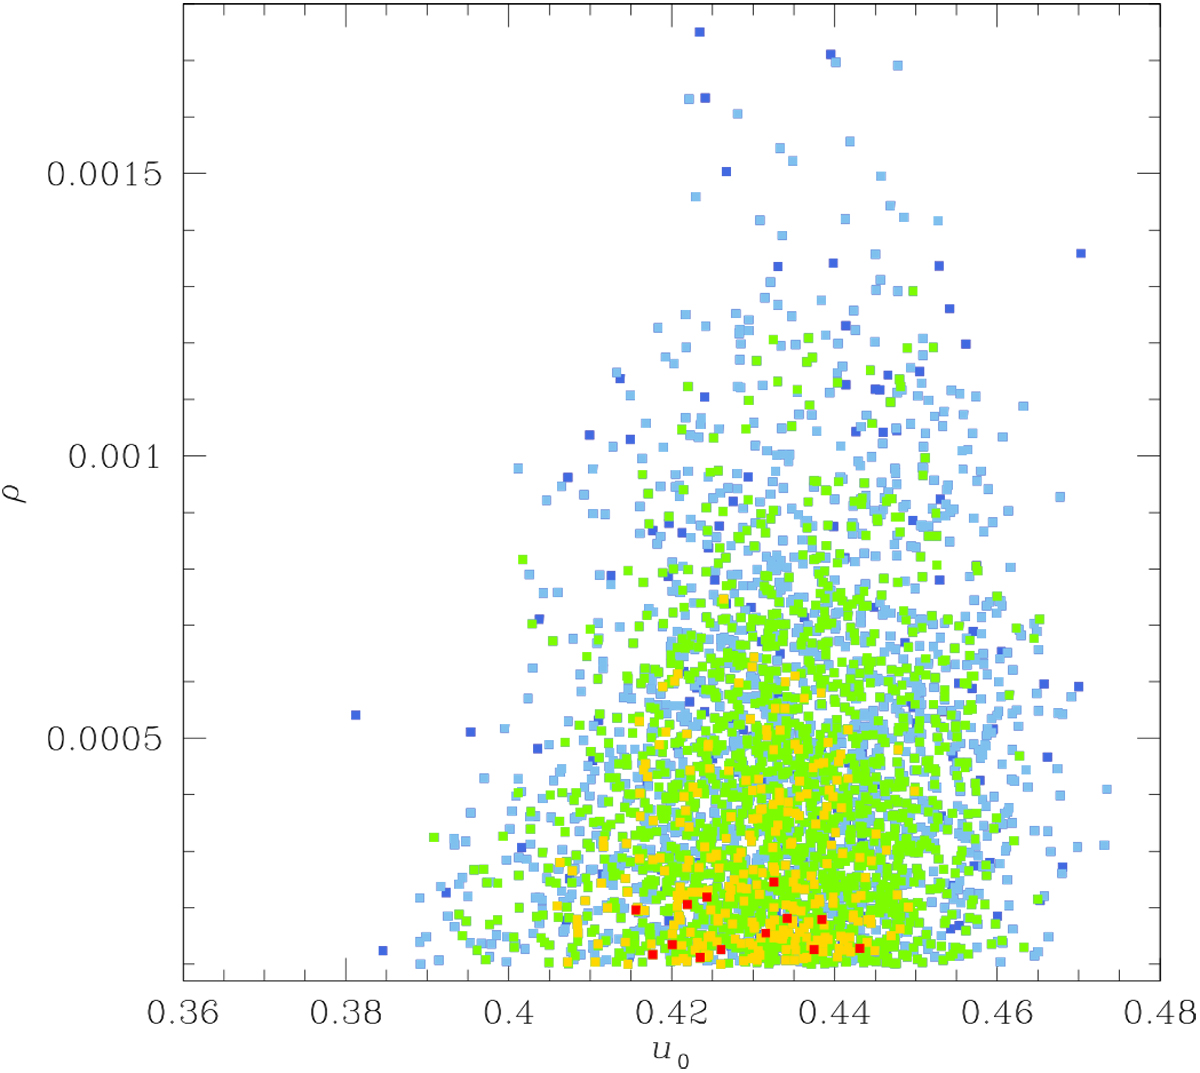
Scatter plot of points in the MCMC chain on the u0–ρ parameter plane obtained from the 2L1S modeling of the OGLE-2019-BLG-0954 lensing light curve. The colors of the points are defined in the same way as in Fig. 7.
Current usage metrics show cumulative count of Article Views (full-text article views including HTML views, PDF and ePub downloads, according to the available data) and Abstracts Views on Vision4Press platform.
Data correspond to usage on the plateform after 2015. The current usage metrics is available 48-96 hours after online publication and is updated daily on week days.
Initial download of the metrics may take a while.