Fig. 9.
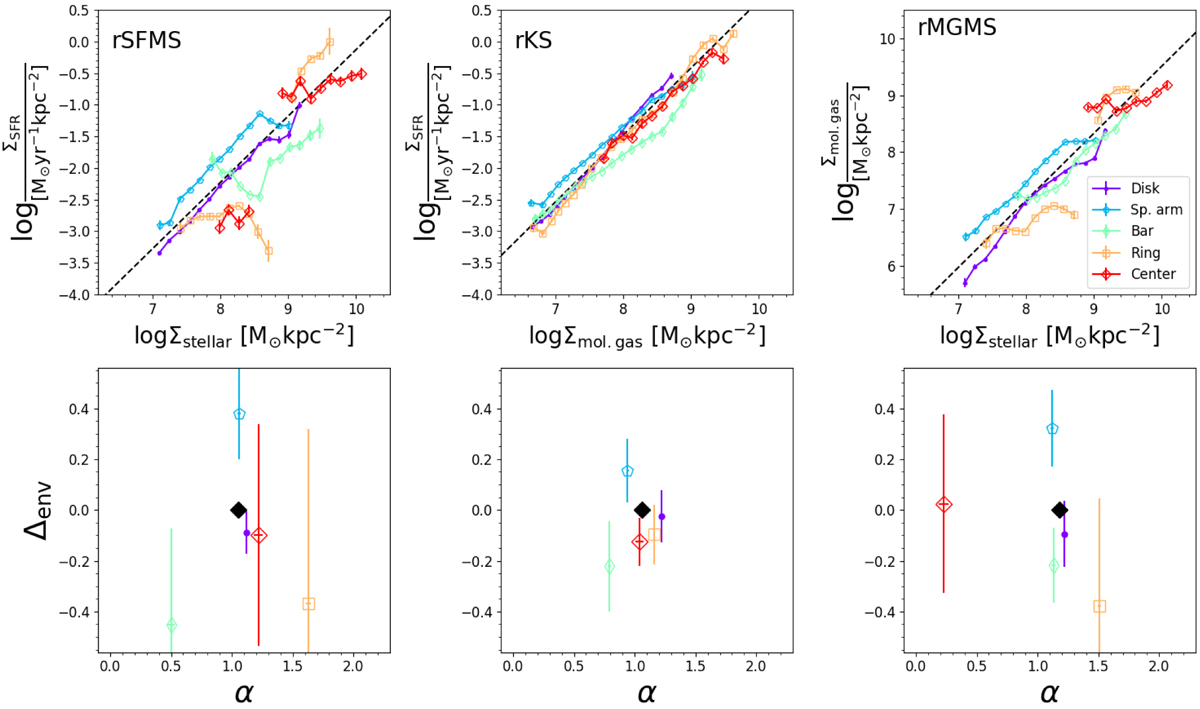
Variations across different galactic environments for the rSFMS (left), rKS (center) and rMGMS (right) relations. Top row: binned data for each galactic environment separately, following the same color scheme from Fig. 7, while the black dashed line shows the overall best-fitting power law to all data points together. Bottom row: slope measured for each individual environment (on the x-axis). The vertical offset between each binned environment and the overall best-fitting power law is reported on the y-axis. It has been calculated by fitting a power law with a fixed slope (that of the overall relation) to each binned environment, and computing the intercept difference respect to the overall best fitting power law. Its error-bars represent the standard deviation of the difference between the binned environment and the overall best fit. The black diamond show the slope of the overall best-fitting power law (see Sect. 4.2 for discussion).
Current usage metrics show cumulative count of Article Views (full-text article views including HTML views, PDF and ePub downloads, according to the available data) and Abstracts Views on Vision4Press platform.
Data correspond to usage on the plateform after 2015. The current usage metrics is available 48-96 hours after online publication and is updated daily on week days.
Initial download of the metrics may take a while.