Fig. 8.
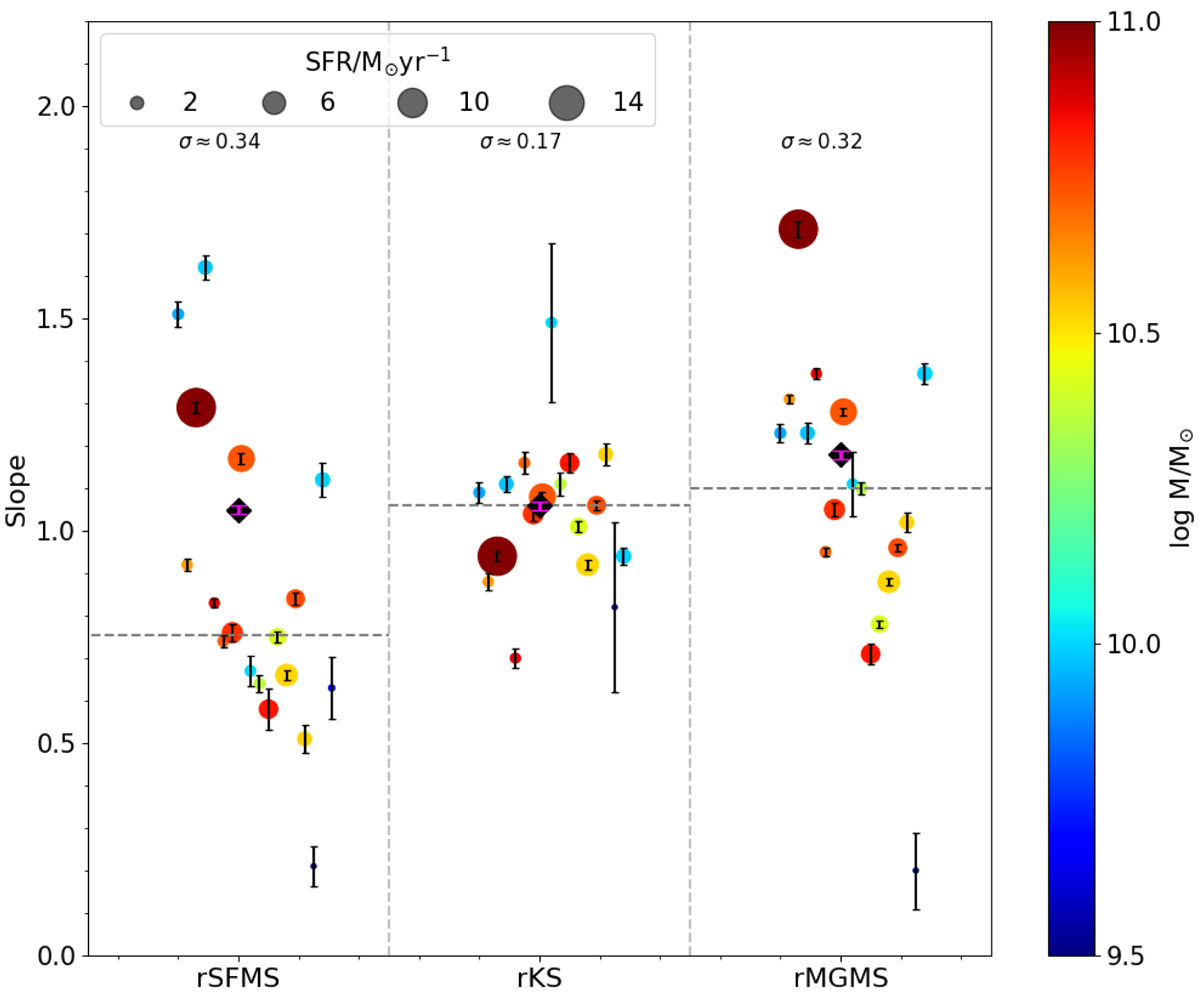
Slopes measured for the rSFMS, rKS and rMGMS for the individual galaxies in our sample. Each circle represents a galaxy. The size and color of each point scales with total SFR and stellar mass of the galaxy, respectively. The dispersion of the slope values for each relation is indicated on the top of the panel. The horizontal shift is arbitrary, with galaxies ordered from left to right by NGC number. The two galaxies with larger error bars in the KS law correspond to NGC 2835 and NGC 5068. This is due to the low number of data points available, as can be seen in Fig. 6. The black diamond with the magenta error bar indicates the global measurement for each relation. The horizontal gray dashed line show the median slope for each relation, in a galaxy basis.
Current usage metrics show cumulative count of Article Views (full-text article views including HTML views, PDF and ePub downloads, according to the available data) and Abstracts Views on Vision4Press platform.
Data correspond to usage on the plateform after 2015. The current usage metrics is available 48-96 hours after online publication and is updated daily on week days.
Initial download of the metrics may take a while.