Open Access
Fig. 5.
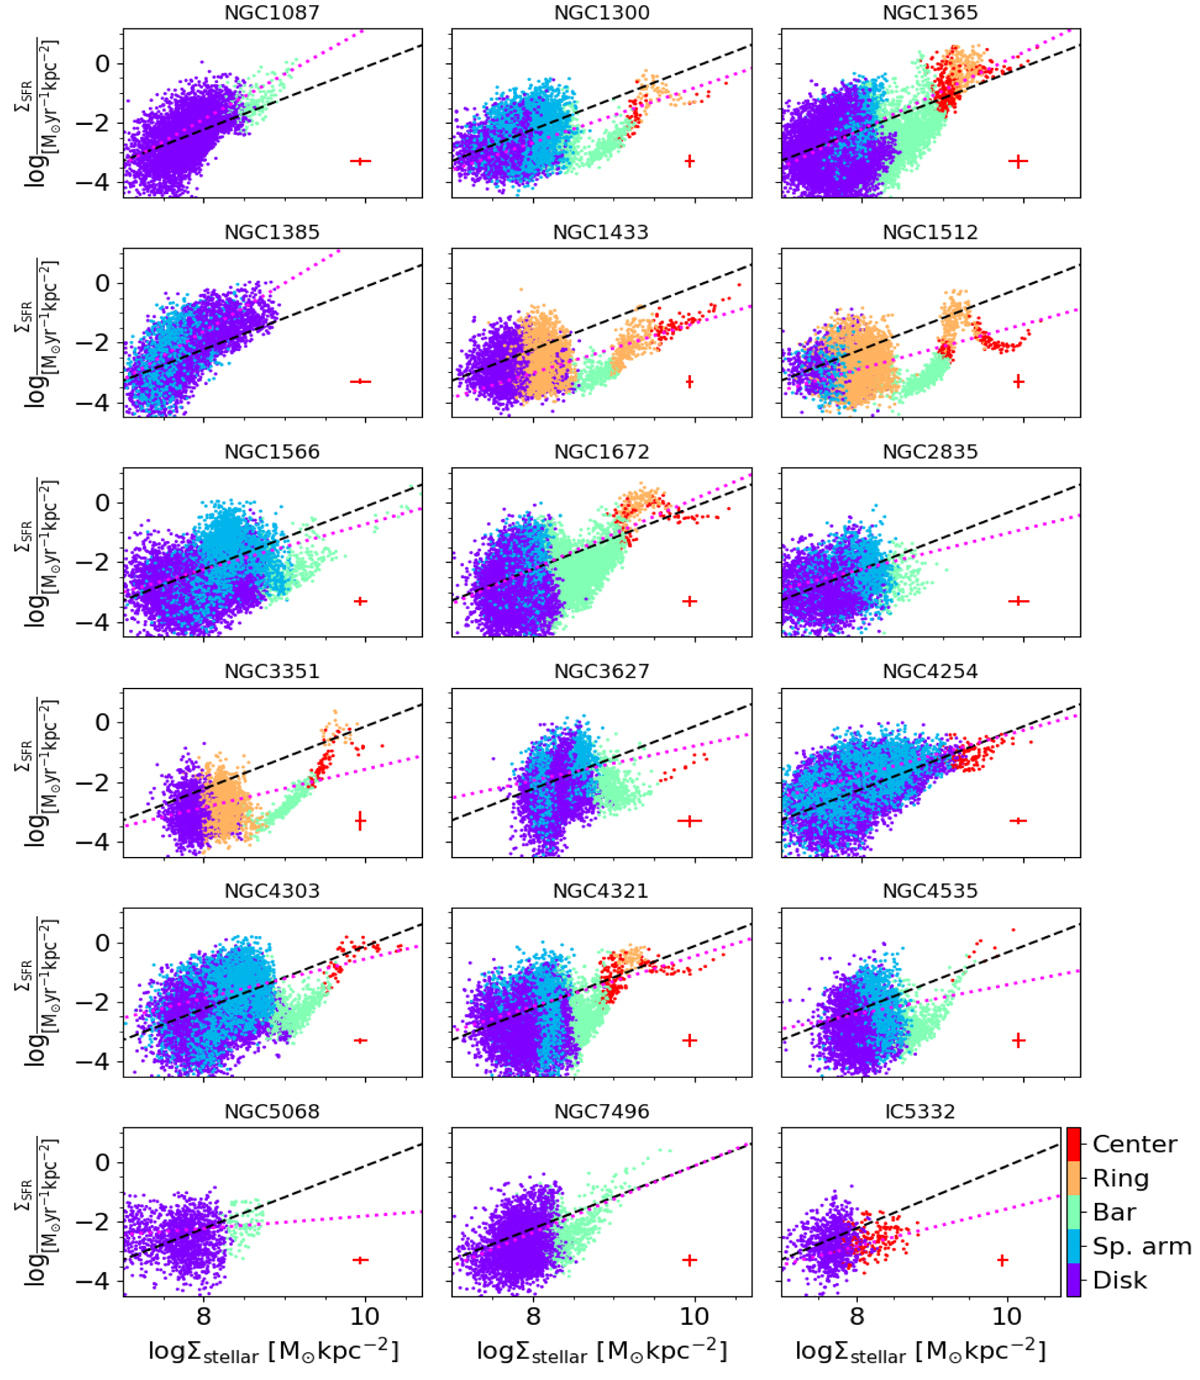
rSFMS for each galaxy at 100 pc resolution. Different environment in the galaxies are colored according to the color scale next to the bottom right panel. The dashed black line represents the best-fitting power law to the overall measurement and the magenta line shows the best-fitting power law for each galaxy.
Current usage metrics show cumulative count of Article Views (full-text article views including HTML views, PDF and ePub downloads, according to the available data) and Abstracts Views on Vision4Press platform.
Data correspond to usage on the plateform after 2015. The current usage metrics is available 48-96 hours after online publication and is updated daily on week days.
Initial download of the metrics may take a while.