Fig. 4.
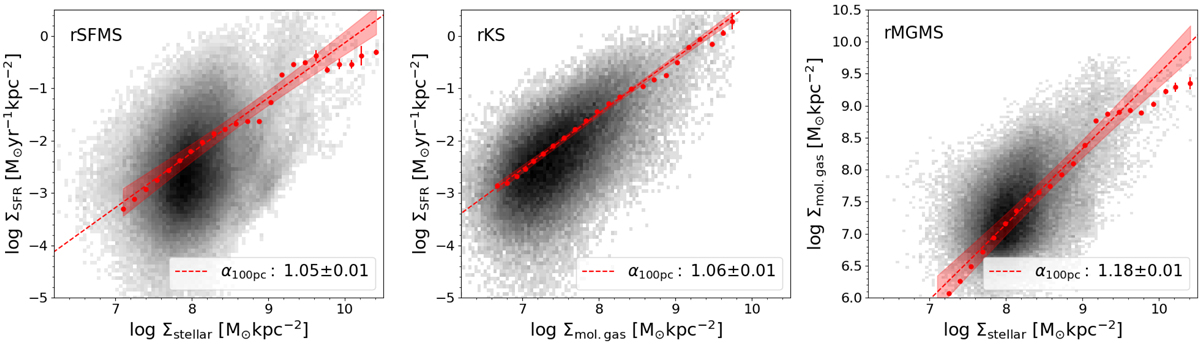
2D distribution of the overall resolved star formation main sequence (left), resolved Kennicutt–Schmidt relation (center), and molecular gas main sequence (right) at 100 pc spatial scale. The red points show the mean binned data and the red dashed line is the best-fitting power law. The colored region shows the 98% confidence interval of the linear fit.
Current usage metrics show cumulative count of Article Views (full-text article views including HTML views, PDF and ePub downloads, according to the available data) and Abstracts Views on Vision4Press platform.
Data correspond to usage on the plateform after 2015. The current usage metrics is available 48-96 hours after online publication and is updated daily on week days.
Initial download of the metrics may take a while.