Fig. 3.
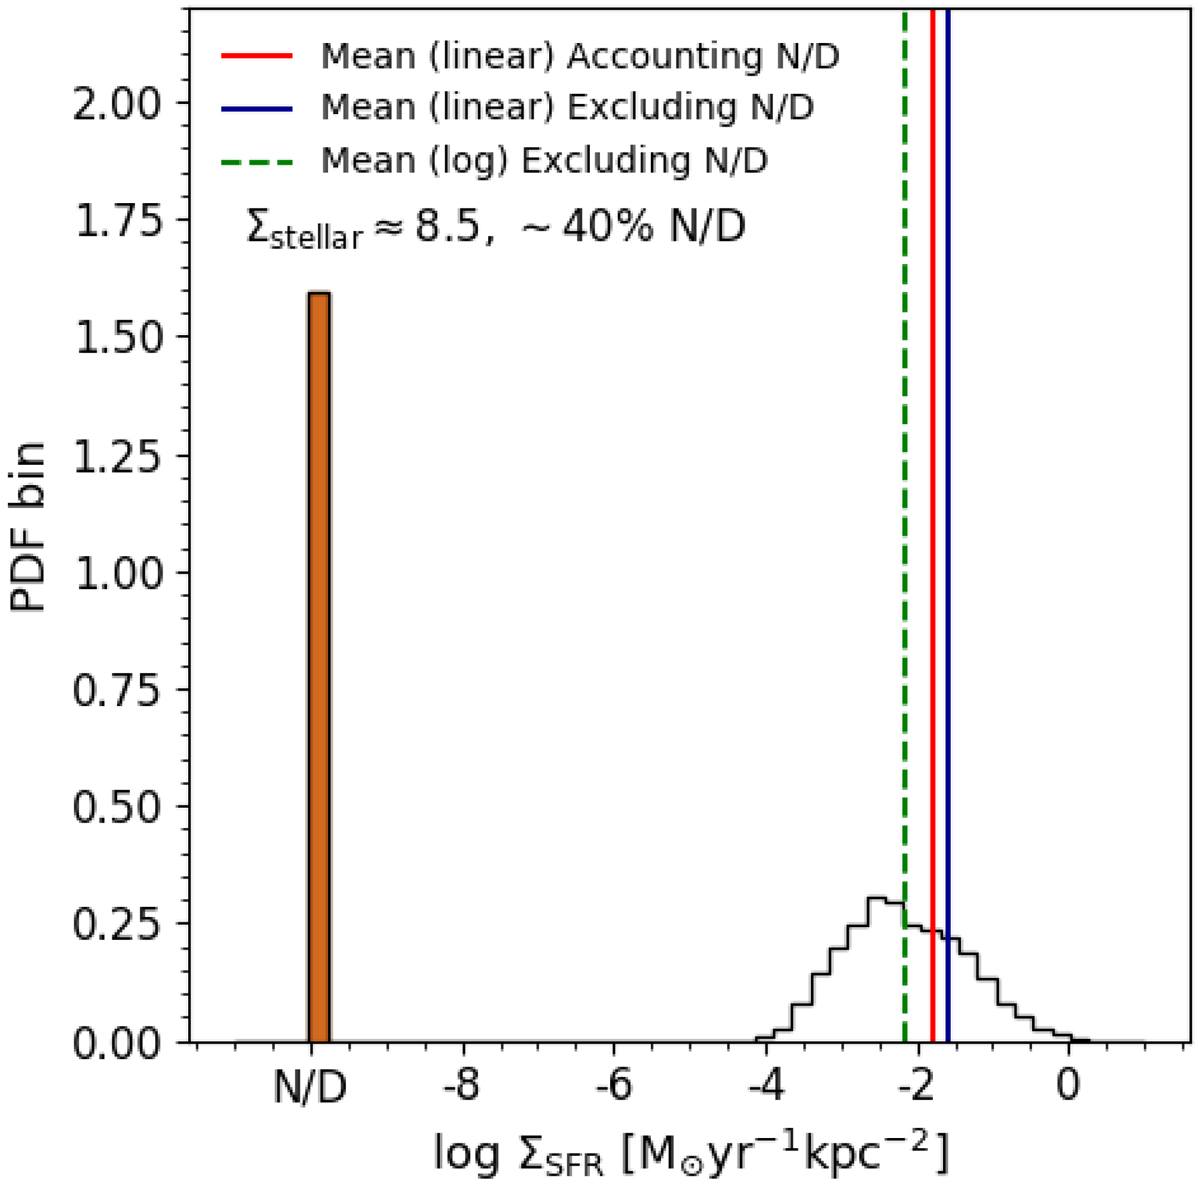
Distribution of the SFR surface density values within the mass bin of log Σstellar [M⊙ pc−2]≈8.5. Around 40% of the pixels are not detected in ΣSFR and we observe a bimodality in the distribution. These non-detections have been highlighted in brown and moved to an artificial value (N/D). The vertical lines correspond to the derived average value for the three binning schemes in Fig. 2. The mean in log-space (green dashed line) matches the peak of the distribution of detections, while the mean in linear space (red and blue solid lines) correspond to the average SFR at this stellar mass surface density, including and excluding N/D, respectively.
Current usage metrics show cumulative count of Article Views (full-text article views including HTML views, PDF and ePub downloads, according to the available data) and Abstracts Views on Vision4Press platform.
Data correspond to usage on the plateform after 2015. The current usage metrics is available 48-96 hours after online publication and is updated daily on week days.
Initial download of the metrics may take a while.