Fig. A.1.
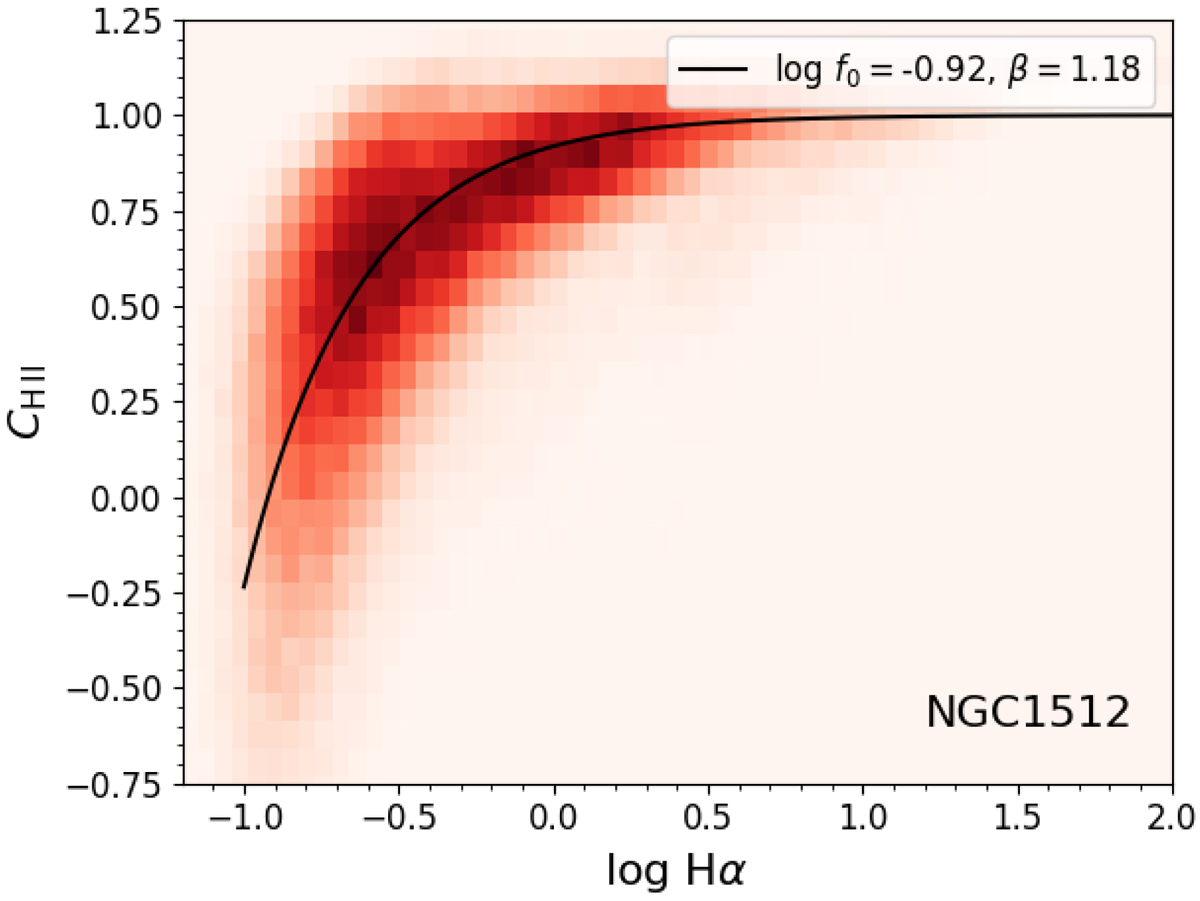
2D distribution of the CH II fraction values of the pixels at the MUSE native resolution in NGC 1512 as defined in Eq. (2), as a function of the log Hα flux surface density of each pixel, in units of 10−20 erg s−1 cm−2 pc2. The black solid line shows the best-fitting parametrization, as described in Eq. (3). The obtained f0 and β parameters are shown in the top of the panel.
Current usage metrics show cumulative count of Article Views (full-text article views including HTML views, PDF and ePub downloads, according to the available data) and Abstracts Views on Vision4Press platform.
Data correspond to usage on the plateform after 2015. The current usage metrics is available 48-96 hours after online publication and is updated daily on week days.
Initial download of the metrics may take a while.