Fig. 22.
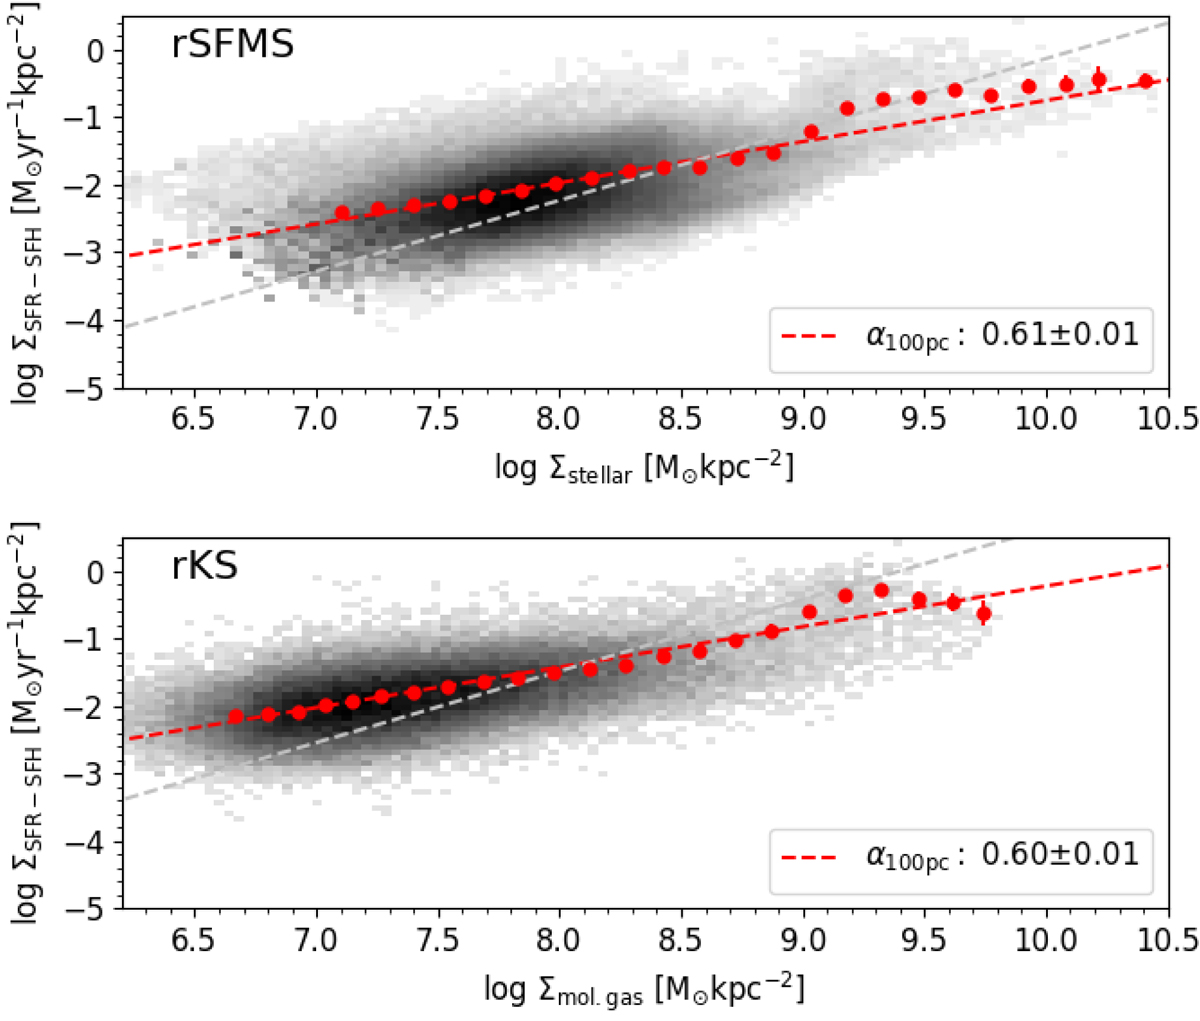
rSFMS (top) and rKS (bottom) measured at 100 pc resolution, using all available pixels from our sample and adopting a SFR tracer with a longer timescale. We have used the derived SFH to compute a SFR tracer sensitive to SF episodes in the last 150 Myr. This smooths the SFR measurements, flattens both relations, and reduces their scatter. The red dashed line show best-fitting power law to the binned data (red points). The best fit obtained with the fiducial approach is indicated with the gray line.
Current usage metrics show cumulative count of Article Views (full-text article views including HTML views, PDF and ePub downloads, according to the available data) and Abstracts Views on Vision4Press platform.
Data correspond to usage on the plateform after 2015. The current usage metrics is available 48-96 hours after online publication and is updated daily on week days.
Initial download of the metrics may take a while.