Fig. 20.
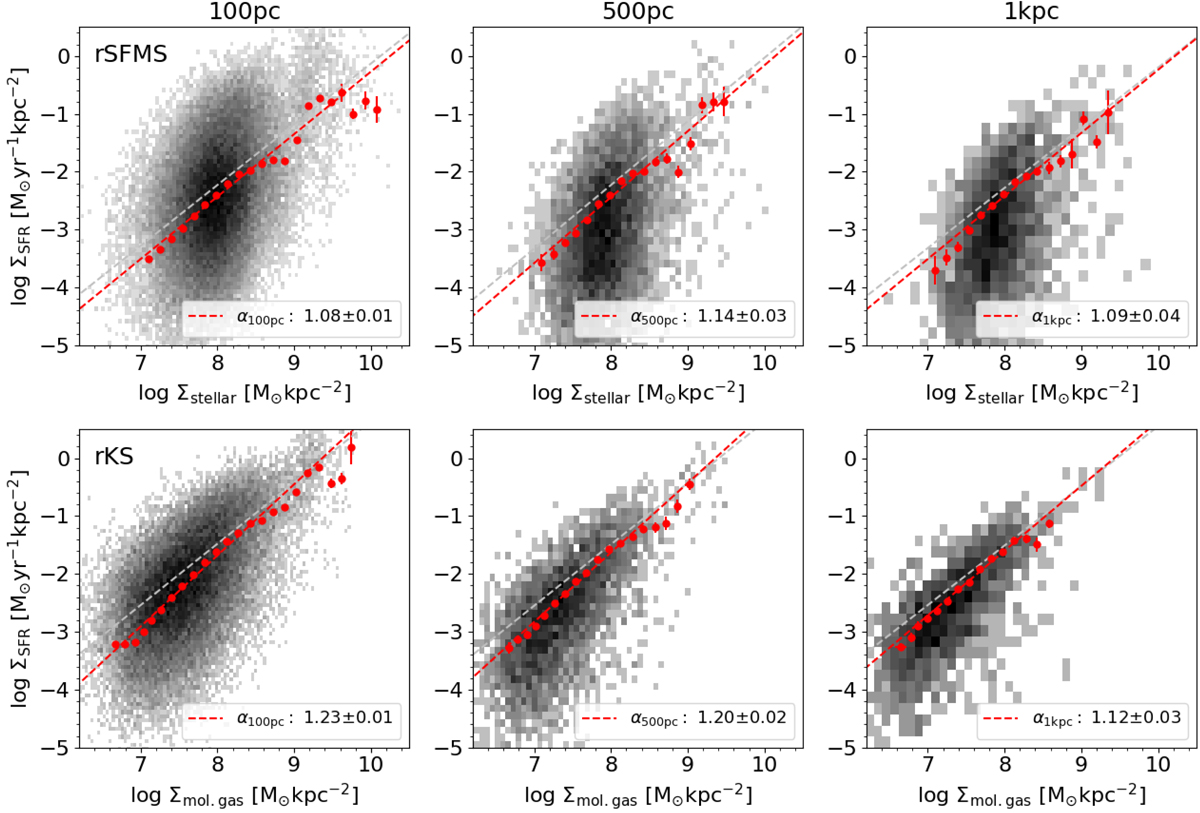
Effect of excluding diffuse gas emission before resampling: 2D distributions of the overall rSFMS (top row) and rKS (bottom row) using all the available pixels in our sample, probed at spatial scales of 100 pc (left column), 500 pc (middle column) and 1 kpc (right column). The x-axis binning and the best-fitting power law are indicated with red dots and a red dashed line respectively. The measured slope and its error are indicated in each panel (see Sect. 5.4.1 for details). The fiducial overall best-fitting power law at each spatial scale is marked with the gray dashed line for reference.
Current usage metrics show cumulative count of Article Views (full-text article views including HTML views, PDF and ePub downloads, according to the available data) and Abstracts Views on Vision4Press platform.
Data correspond to usage on the plateform after 2015. The current usage metrics is available 48-96 hours after online publication and is updated daily on week days.
Initial download of the metrics may take a while.