Fig. 19.
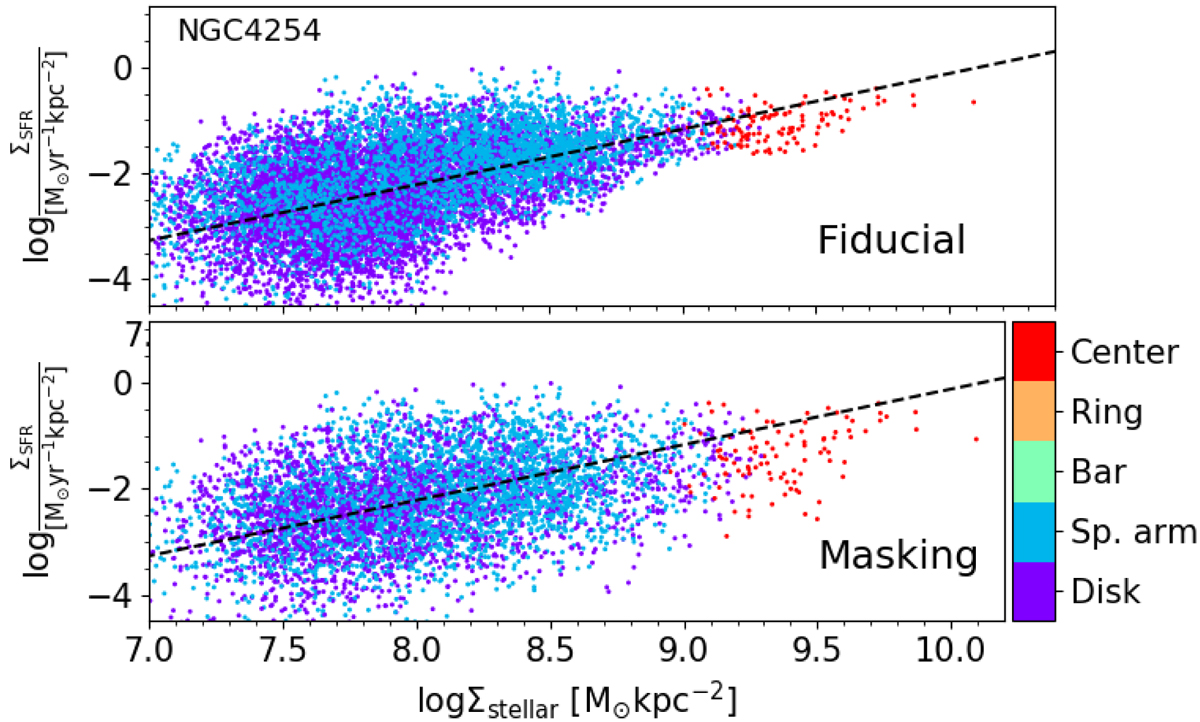
rSFMS of one galaxy in our sample (NGC 4254) to illustrate the effect of removing Hα emission not associated with morphologically defined H II regions before resampling the SFR surface density map. Top: fiducial methodology. Bottom: alternative methodology as described in Sect. 5.4.1. The color scheme is the same as in Fig. 6. The black line correspond to the global rSFMS measured using all pixels with the fiducial approach (see Fig. 4).
Current usage metrics show cumulative count of Article Views (full-text article views including HTML views, PDF and ePub downloads, according to the available data) and Abstracts Views on Vision4Press platform.
Data correspond to usage on the plateform after 2015. The current usage metrics is available 48-96 hours after online publication and is updated daily on week days.
Initial download of the metrics may take a while.