Open Access
Fig. 16.
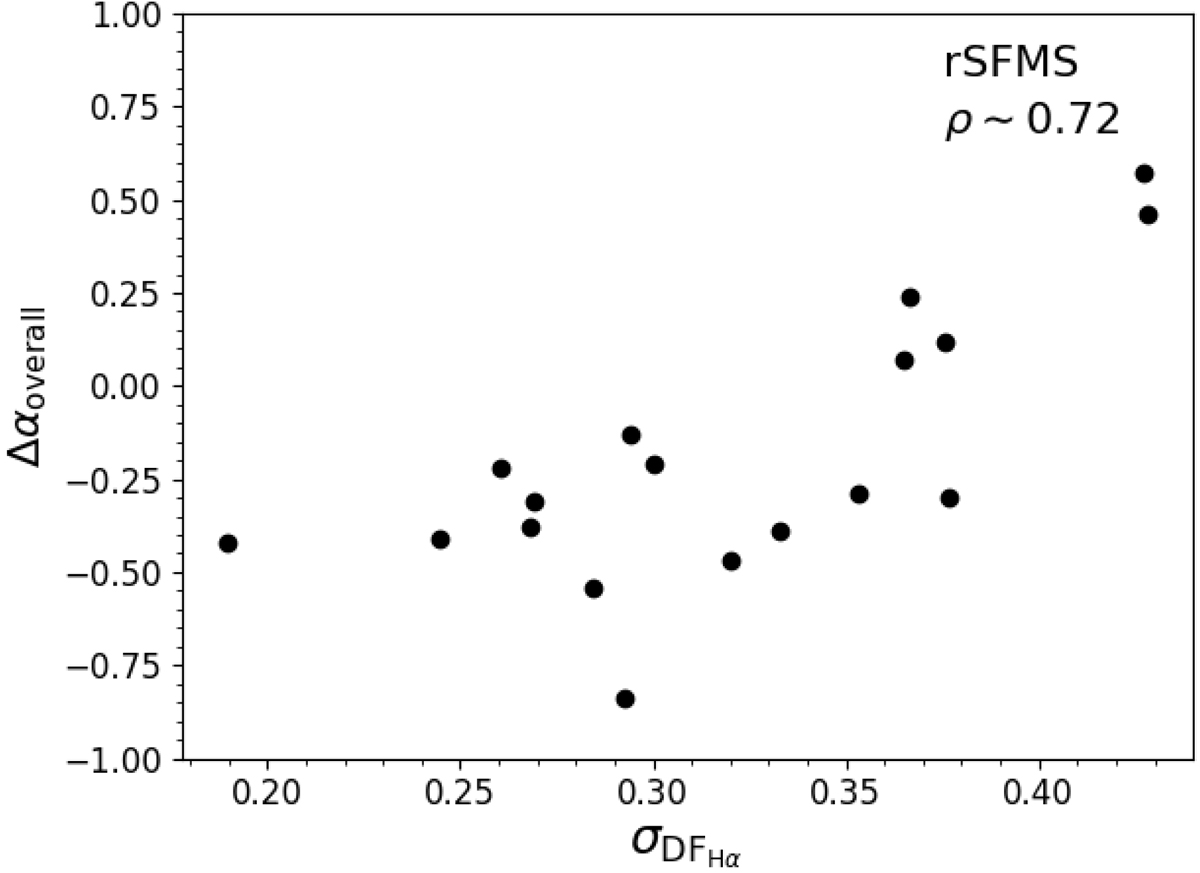
Difference between the slope of the rSFMS of each galaxy measured with the fiducial approach and the overall measurement as a function of the standard deviation of the detection fraction distribution of the SFR tracer in each galaxy (σDFHα). The PCC of the correlation is indicated in the top-right corner of the panel.
Current usage metrics show cumulative count of Article Views (full-text article views including HTML views, PDF and ePub downloads, according to the available data) and Abstracts Views on Vision4Press platform.
Data correspond to usage on the plateform after 2015. The current usage metrics is available 48-96 hours after online publication and is updated daily on week days.
Initial download of the metrics may take a while.