Fig. 1.
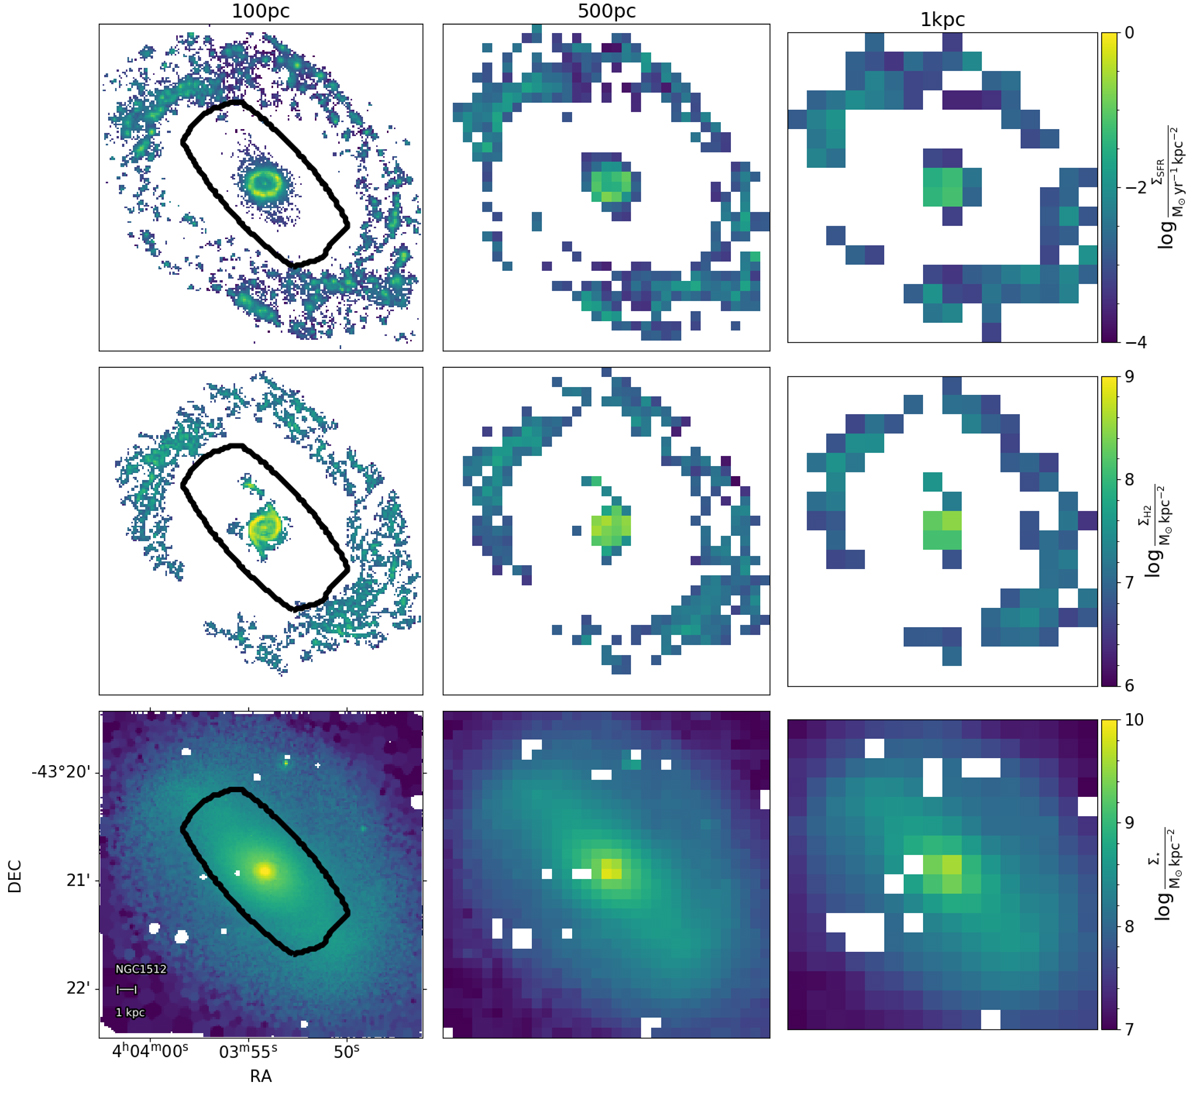
Example of SFR, molecular gas, and stellar mass surface density (top, middle, and bottom row) at spatial scales of 100 pc, 500 pc and 1 kpc (left, middle, and right column) for one of the galaxies in our sample (NGC 1512). The black contour in each row encloses the pixels within the bar of the galaxy. Foreground stars have been masked in the stellar mass surface density maps (white pixels in bottom row).
Current usage metrics show cumulative count of Article Views (full-text article views including HTML views, PDF and ePub downloads, according to the available data) and Abstracts Views on Vision4Press platform.
Data correspond to usage on the plateform after 2015. The current usage metrics is available 48-96 hours after online publication and is updated daily on week days.
Initial download of the metrics may take a while.