| Issue |
A&A
Volume 650, June 2021
|
|
|---|---|---|
| Article Number | A61 | |
| Number of page(s) | 12 | |
| Section | Astrophysical processes | |
| DOI | https://doi.org/10.1051/0004-6361/202140659 | |
| Published online | 08 June 2021 | |
Magnetized relativistic jets and helical magnetic fields
II. Radiation
1
Instituto de Astrofísica de Andalucía (CSIC), Glorieta de la Astronomía s/n, 18008 Granada, Spain
2
Departamento de Astronomía y Astrofísica, Universitat de València, 46100 Burjassot, València, Spain
e-mail: This email address is being protected from spambots. You need JavaScript enabled to view it.
3
Observatori Astronòmic, Universitat de València, 46980 Paterna, València, Spain
Received:
25
February
2021
Accepted:
2
April
2021
Abstract
This is the second of a series of two papers that deepen our understanding of the transversal structure and the properties of recollimation shocks of axisymmetric, relativistic, superfast magnetosonic, overpressured jets. They extend previous work that characterized these properties in connection with the dominant type of energy (internal, kinetic, or magnetic) in the jet to models with helical magnetic fields with larger magnetic pitch angles and force-free magnetic fields. In the first paper of this series, the magnetohydrodynamical models were computed following an approach that allows studying the structure of steady, axisymmetric, relativistic (magnetized) flows using one-dimensional time-dependent simulations. In this paper, synthetic radio images of the magnetohydrodynamical models are produced based on two different models to connect the thermal particle population, modeled by the hydrodynamical code, and the nonthermal particle population (added in post-processing) that causes the synchrotron radiation. The role of the magnetic tension and the Lorentz force in modeling the observational appearance of jets, namely the cross-section emission asymmetries, spine brightening, relative intensity of the knots, and polarized emission is analyzed. A cross-section emission asymmetry caused by a differential change in the angle between the helical magnetic field and the line of sight across the jet width is observed in all models and for both synchrotron emission approximations, as expected from a purely geometrical origin, for viewing angles < 10°. Models with the highest magnetizations and/or magnetic pitch angles lead to an uneven distribution of the internal energy as a consequence of the larger relative magnetic tension and radial Lorentz force, which translates into a spine brightening in the total and linearly polarized intensity maps. Force-free models display a distinct spine brightening that originates in the radial gradient of the axial magnetic field. Highly magnetized jets with large toroidal fields tend to have weaker shocks and correspondingly weaker radio knots. Signatures of this toroidal field can be found in the linearly polarized synchrotron emission for jets with large enough magnetic pitch angles and large enough viewing angles.
Key words: galaxies: jets / magnetic fields / magnetohydrodynamics (MHD) / methods: analytical / methods: numerical
© ESO 2021
1. Introduction
The dynamics of relativistic jets have been studied through numerical simulations for more than twenty years now with great success (e.g., Martí 2019, and references therein). However, the importance of relativistic and projection effects dominating the emission (e.g., Gómez et al. 1993, 1994a,b), makes computing the radiative output a necessary step for a comparison with very long baseline interferometric (VLBI) observations of active galactic nuclei (AGN) jets. This paper studies the nonthermal radio emission that is expected based on the magnetohydrodynamic jet models that we presented in the accompanying paper in this series (Moya-Torregrosa et al. 2021; hereafter Paper I), and analyzes the most salient features with a clear focus on the interpretation of VLBI observations of AGN jets.
Paper I focused on understanding the transversal structure and the properties of recollimation shocks of axisymmetric, relativistic, superfast magnetosonic, overpressured jets. These relativistic magnetohydrodynamical (RMHD) jet models were computed following the approach developed by Komissarov et al. (2015). In this work, the emphasis is on the signature of these structural ingredients in synthetic synchrotron maps mimicking radio observations of AGN jets at parsec scales. The radiative simulations are performed using the same code as in Fuentes et al. (2018), which are thoroughly described in Gómez et al. (1993, 1994a,b, 1995, 1997). The code connects the thermal particle population (modeled by the RMHD code) and the nonthermal particle population to obtain synthetic radio maps for the total and polarized synchrotron emission. These works extend the previous work by Fuentes et al. (2018) to models with helical magnetic fields with larger magnetic pitch angles and force-free configurations.
Establishing a relation between the thermal and nonthermal populations requires a detailed prescription for the particle acceleration processes that connect both populations, presumably taking place in strong shocks or in magnetic reconnection events (see, e.g., Sironi et al. 2015). A proper treatment of particle acceleration or injection in shocks (e.g., Kirk et al. 2000) or magnetic reconnection (e.g., Lyubarsky 2005) requires a microscopic description of the fluid that is not implemented in our RMHD approach. Nevertheless, as a first-order approximation, two approaches connecting the thermal and nonthermal particle populations in a post-processing phase were considered. In the first approach (following Gómez et al. 1995, 1997; Komissarov & Falle 1997; Broderick & McKinney 2010; Porth et al. 2011), the particle acceleration takes place at shocks, and the internal energy of the nonthermal population is a constant fraction of the thermal electron energy density considered in the RMHD simulations. In the second approach, which mimicks the transfer of energy at magnetic reconnection sites, the nonthermal population energy density is taken as proportional to the magnetic energy density (Porth et al. 2011). In the case of force-free models, only the emission of the strongly magnetically dominated cases under the second particle acceleration approach was computed.
The paper is organized as follows. Section 2 summarizes the properties of the magnetohydrodynamic models that constitute the basis of the emission study undertaken in this work. Section 3 describes the numerical code connecting the thermal particle population (modeled by the RMHD code) and the nonthermal particles population that causes the synchrotron radiation. In Sects. 4–6, we focus our analysis on the total intensity features (in particular, cross-section emission asymmetries, spine brightening, and the relative intensity of the knots) as a function of the magnetic field geometry and internal jet structure. In Sect. 7 we discuss the polarization properties from our numerical models and their relevance for the interpretation of actual observations of AGN jets. A summary of the paper along with the most relevant conclusions is given in Sect. 8.
2. Summary of magnetohydrodynamical models
In Paper I we presented a series of numerical models of steady, axisymmetric, relativistic, nonrotating jets with helical magnetic fields. These models are characterized by five functions, namely the density and the pressure, ρj(r) and pj(r), respectively, the axial component of the velocity,  , and the azimuthal and axial components of the magnetic field,
  and
and  . Top-hat functions with fixed values for the jet density and the axial flow speed (Lorentz factor, 3.20) were chosen. Jets were injected into a homogeneous nonmagnetized ambient medium at rest with an overpressure factor, K = 2. Finally, two different magnetic field configurations, force-free and non-force-free, were considered. The averaged helical magnetic pitch angle in the force-free models, ℱϕ77.5, is 77.5°. Non-force-free models were constructed with two different averaged magnetic pitch angles, 45° (𝒩ϕ45) and 77.5° (𝒩ϕ77.5). The parameters defining the models as well as the scheme followed in the model names appear in Table 1 of Paper I. Figure 2 of that paper displays the models in the (fast-magnetosonic) relativistic Mach number-specific internal energy plane.
When the remaining parameters are the same, increasing the magnetic pitch angle from 45° to 77.5° leads to an increase in the magnetic tension. In non-force-free models, an increase in the magnetic pitch angle like this leads to an increase in the radial Lorentz force as well. In force-free models, the radial Lorentz force is zero by construction.
Our results showed that the internal structure of overpressured, superfast magnetosonic jets results from the superposition of (i) the internal transversal equilibrium of the jet (governed by the Lorentz force), and (ii) recollimation shocks and sideways expansions and compressions of the jet flow (whose amplitudes depend on the magnetic tension and the internal energy content).
3. Emission code and nonthermal particle injection model
The numerical code used to compute the synchrotron emission radiated by the jet models described in the previous sections is thoroughly discussed in Gómez et al. (1993, 1994a,b, 1995, 1997), Fuentes et al. (2018), and references therein. We note that one of the key aspects when computing the radio continuum emission from RMHD jets is to establish a connection between the thermal particle population, which is modeled by the RMHD code, and the nonthermal particle population, which is responsible for the synchrotron radiation. As was discussed in Fuentes et al. (2018), a complete description of particle acceleration mechanisms connecting both populations within the jet, either through magnetic reconnection (Lyubarsky 2005) or acceleration at shock fronts (Kirk et al. 2000), would invoke vastly different scales and hence a computational cost that is not affordable for global RMHD jet simulations. It is therefore usually assumed that the internal energy of the nonthermal particle population is either proportional to that of the thermal population, that is, to the simulated gas pressure (Zakamska et al. 2008; Porth et al. 2011), or to the magnetic energy density (Broderick & McKinney 2010; Porth et al. 2011). This last approach is of special interest because of the extensive analysis of the magnetic field configuration that is carried out in this work. We call these two emission approximations hereinafter model–p (Mp) and model–B (MB), respectively.
When we assume a typical power-law function N(E)dE = N0E−γdE, where Emin ≤ E ≤ Emax, the distribution of the nonthermal particles energy is then determined by the expressions (e.g., Gómez et al. 1995)
![Mathematical equation: $$ \begin{aligned}&N_0=\left[\frac{\Lambda (\gamma -2)}{1-C_E^{2-\gamma }}\right]^{\gamma -1}\left[\frac{1-C_E^{1-\gamma }}{\rho (\gamma -1)}\right]^{\gamma -2}, \end{aligned} $$](/articles/aa/full_html/2021/06/aa40659-21/aa40659-21-eq4.gif) (1)
(1)
 (2)
(2)
In the previous expressions, Λ is a constant fraction of the internal energy density of the thermal particles or of the magnetic energy density (B′2/8π, where B′ is the magnetic field computed in the fluid frame), depending on the desired particle acceleration model (Mp or MB, respectively). ρ is a constant fraction of the rest-mass density computed by the RMHD code in the fluid frame, and the ratio CE = Emax/Emin is kept constant throughout the jet because radiative losses are marginal. In our models we neglect any Faraday rotation effects on the plane of polarization to better isolate the polarization properties of our models as a function of the internal jet structure and magnetic field configuration. Similarly, we neglect any opacity effects by setting the model parameters so that the jets are optically thin. Total and linearly polarized intensity values are given in arbitrary units.
The analysis of the observational imprints associated with the magnetic field configuration is based on a selection of the models considered in Paper I: (i) 𝒩ϕ45 models: ℳ3.5β1, ℳ3.5β17.5, ℳ10β1, and ℳ10β17.5, corresponding to models M2B2, M2B4, M5B2, and M5B4, respectively, of Fuentes et al. (2018), are taken as reference; (ii) 𝒩ϕ77.5 models: ℳ3.5β1, ℳ3.5β2.34, ℳ10β1, and ℳ10β2.34; (iii) ℱϕ77.5 models: ℳ3.5β100 and ℳ10β100. Non-force-free models are considered under both Mp and MB particle injection approaches. Consistently with their force-free character, only the strongly magnetically dominated ℱϕ77.5 models ℳ3.5β100 and ℳ10β100 were considered, and only under the MB particle acceleration model.
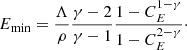
The radio-continuum total and linearly polarized flux density images for models 𝒩ϕ45 are shown in Figs. 11–18 of Fuentes et al. (2018). We note that only the Mp particle acceleration model was used for the emission computation of these models because the Mp and MB models yield very similar results, with the exception of a much brighter central spine in the highly magnetized models 𝒩ϕ45ℳ3.5β17.5 and 𝒩ϕ45ℳ10β17.5 under the MB particle acceleration model (see Sect. 3.3 of Fuentes et al. 2018). In Figs. 1–4 we show the total intensity, linearly polarized intensity, and degree of linear polarization of the 𝒩ϕ77.5 and ℱϕ77.5 jet models for viewing angles θ = 2°, 5°, 10°, and 20°.
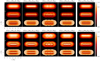 |
Fig. 1. Total intensity (I), linearly polarized intensity (P), with EVPAs overplotted as black bars, and degree of linear polarization (Π) of the 𝒩ϕ77.5 and ℱϕ77.5 jet models, computed for the two particle injection approximations (Mp and MB) and a viewing angle of 2°. Total and polarized intensity values are normalized to unity. Axis units represent the distance in jet radius units. |
4. Cross-section emission asymmetry
The helical geometry of the magnetic field leaves a clear imprint on the emission models. Following the discussion in Sect. 3.2 of Fuentes et al. (2018), the angle between the magnetic field and the line of sight in the fluid frame ϑ′ introduces an asymmetry in the emission via the sin ϑ′ term in the emission coefficients (Aloy et al. 2000; Lyutikov et al. 2005; Clausen-Brown et al. 2011). This is clearly visible across the jet when the viewing angle in the fluid frame deviates from 90°, which corresponds to ≈18° in the observer’s frame for a flow velocity of vj ∼ 0.95c. This asymmetry is clearly visible in Figs. 1–3, showing a brighter emission in the top halves of the jets, whereas the asymmetry is not present in Fig. 4, as expected for a viewing angle close to 18°.
Figure 5 shows for the Mp (Fig. 5a) and MB (Fig. 5b) injection models the transverse profiles of the total and polarized intensity and the degree of polarization integrated along the jet for each jet model at viewing angles of 2° and 20°, which maximizes and minimizes the cross-section asymmetry, respectively. The emission asymmetry discussed and analyzed in Fuentes et al. (2018) for 𝒩ϕ45 jet models under Mp is now also seen in models 𝒩ϕ77.5 and ℱϕ77.5 for the injection approximations Mp and MB (see also Fig. 1), as expected from the purely geometrical origin of the effect. For a viewing angle of 2°, the bulk of the jet emission is concentrated in the top half of the jet, and the peak intensity is displaced from the jet axis. In addition, the transversal emission profiles of models 𝒩ϕ77.5 display a striking bump in the bottom half of the jet for Mp, which turns into a plateau for MB. At 20°, the asymmetry in the total intensity profiles has almost disappeared (see Fig. 4). The ℱϕ77.5 models under consideration display the most symmetric emission (MB) at any viewing angle.
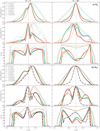 |
Fig. 5. a: total intensity (I), linearly polarized intensity (P), and degree of linear polarization (Π) integrated transverse profiles of the 𝒩ϕ45 and 𝒩ϕ77.5 jet models, computed for viewing angles θ = 2° (left) and 20° (right), and for the particle injection model Mp. Models with equal color but different line style differ only in the magnetic pitch angle value. Total and linearly polarized intensity values are normalized to unity. The negative and positive values of the abscissa axes represent the bottom and top halves of the jets (assuming they propagate horizontally from left to right), expressed in jet radius units, respectively. b: same panel distribution as above, but computed following the particle injection model MB, which includes the ℱϕ77.5 jet models. |
We now focus on the profiles of the polarized intensity. The most remarkable feature is that they are much more complex than those of the total intensity, displaying multiple (two or three) peaks, bumps, and plateaus in most cases. At 2°, the largest peak in 𝒩ϕ45 models is in the top half of the jet, whereas the smallest peak is in the bottom half. The situation is reversed for the 𝒩ϕ77.5 and ℱϕ77.5 models (although the top half of the jet dominates the bulk of the polarized emission). At 20°, the polarized emission of models 𝒩ϕ45 is almost symmetric, whereas the emission of 𝒩ϕ77.5 models show asymmetric peaks (as in the case of models 𝒩ϕ77.5ℳ3.5β1 and 𝒩ϕ77.5ℳ10β1 for the Mp and MB injection models; or models 𝒩ϕ77.5ℳ3.5β2.34 and 𝒩ϕ77.5ℳ10β2.34 for MB) or asymmetric bumps (𝒩ϕ77.5ℳ3.5β2.34 and 𝒩ϕ77.5ℳ10β2.34 for Mp). In Sect. 7 we discuss the physical origin of these features.
5. Spine brightening
As discussed previously, magnetic tension and the radial component of the Lorentz force are the key parameters governing the transversal structure of jets. The magnetic tension (together with the overpressure factor) controls the sideways expansion of the jet models and hence the amplitude of their radial oscillations. The radial component of the Lorentz force regulates the gas pressure profile across the jet and hence the distribution of internal energy. Finally, magnetic tension and the radial Lorentz force shape the distribution of magnetic energy density across the jet. It can therefore be predicted that these two quantities, magnetic tension and Lorentz force, leave their imprints on the synchrotron emission maps obtained with the Mp and MB particle injection models.
The distribution of the synchrotron emission across the jet for models 𝒩ϕ45 was analyzed in Fuentes et al. (2018) for Mp. Jets with high magnetizations are narrower and concentrate a larger part of their internal energy in a central spine than their counterparts with the same magnetosonic Mach number and lower magnetizations. This is due to their higher relative magnetic tension and radial Lorentz force. The uneven distribution of the internal energy in the models with the highest magnetizations translates into a spine brightening in the total and polarized intensity (Mp), which is clearly seen in the bottom panels of Figs. 19 and 20 of Fuentes et al. (2018), and also in Fig. 5a (models 𝒩ϕ45ℳ3.5β17.5 and 𝒩ϕ45ℳ10β17.5 versus 𝒩ϕ45ℳ3.5β1 and 𝒩ϕ45ℳ10β1). The spine brightening in total emission under the Mp approach for models 𝒩ϕ45ℳ3.5β17.5 and 𝒩ϕ45ℳ10β17.5 is also seen in Table 1. This table displays the distance in jet radius units from the relative total intensity peak of each model (at a viewing angle of 20°) at which the accumulated emission reaches 50% and 70% of the total emission with the Mp and MB models. The enhancement of the total emission close to the jet axis under the Mp approach for models 𝒩ϕ77.5ℳ3.5β2.34 and 𝒩ϕ77.5ℳ10β2.34 with respect to their less magnetized counterparts (𝒩ϕ77.5ℳ3.5β1 and 𝒩ϕ77.5ℳ10β1, respectively) is also seen in Table 1 (and Figs. 1–5a).
Emission confinement around the jet axis.
The same result is obtained when comparing 𝒩ϕ45 and 𝒩ϕ77.5 models at the same point of the diagram of the magnetosonic Mach number and internal energy. Again, the higher magnetic tension and radial Lorentz force of 𝒩ϕ77.5 models with respect to the 𝒩ϕ45 counterparts produce narrower jets and spine brightening under Mp (see Figs. 1–4, and compare models 𝒩ϕ77.5ℳ3.5β1 and 𝒩ϕ77.5ℳ10β1 with their counterparts, models 𝒩ϕ45ℳ3.5β1 and 𝒩ϕ45ℳ10β1 in Fig. 5a and Table 1).
For the MB particle injection model (Figs. 1–5b and Table 1), the homogeneous distribution of the axial magnetic field component in the 𝒩ϕ45 and 𝒩ϕ77.5 models contributes to smooth out the spine brightening (especially in 𝒩ϕ45 models, where the axial magnetic field is relatively more important). Conversely, force-free models display a distinct spine brightening that originates from the radial gradient of the axial magnetic field.
6. Knot intensity
Associated with recollimation shocks within the jets, a series of bright stationary knots arises over the base emission of the models. These knots may correspond to the stationary components seen in actual VLBI observations of AGN jets, as reported in several works (e.g., Jorstad et al. 2017) and were analyzed in Fuentes et al. (2018) by attending to the dominant type of energy in the jet models. As concluded in that paper for models 𝒩ϕ45, at large viewing angles, hot jets present stronger emission knots than colder jets (consistent with the higher relative intensity of recollimation shocks and wider radial oscillations in the hot models), while at smaller viewing angles, a differential Doppler factor in the pre- and post-shock zones inverts the trend. In this work we analyze the strength of stationary knots in terms of the magnetic field configuration.
Table 2 and Fig. 6 show the averaged knot intensity for each model and under both particle acceleration approximations, computed as the total intensity percentage of consecutive peaks above the underlying emission of the jet and at viewing angles θ = 5°, 10°, and 20°. The viewing angle θ = 2° was excluded from the analysis because the emitting structures within the jets overlapped too strongly to distinguish them correctly.
 |
Fig. 6. Relative intensity of the stationary knots, measured as the integrated total intensity percentage corresponding to knots when the underlying jet emission is removed. Calculations are made for viewing angles θ = 5°, 10°, and 20° and the two particle injection methods, Mp and MB, shown as solid and dashed lines, respectively. ℱϕ77.5 models are drawn as dot-dashed lines. |
Relative intensity of the stationary components.
We focus on the results at θ = 20° and refer to Fuentes et al. (2018) for a deeper analysis on the dependence of the knot intensity on the viewing angle. One of the main trends observed is the large difference in intensity between 𝒩ϕ45 models, which ranges from 70% to 83% of the total emission, and the rest, whose knot intensity peaks at 54% for 𝒩ϕ77.5 models and at 24% for ℱϕ77.5 models. The explanation of the drop in the relative intensity of stationary knots from ϕB = 45° to ϕB = 77.5° models is again the difference in the relative intensity of recollimation shocks and the amplitude of radial oscillations, which is much smaller in the latter (see Tables 4 and 5 of Paper I). According to the discussion in Sect. 5 of Paper I, it follows from Eq. (20) that the smaller magnetic pitch angle ϕB, and hence magnetic tension τm, of the 𝒩ϕ45 models implies greater radial oscillations, which in turn increase the strength of recollimation shocks and ultimately that of stationary emission knots.
Among the models with ϕB = 77.5°, with a relative knot intensity (44%−54%) intermediate between the 𝒩ϕ45 (70%−83%) and the rest (< 34%), we find the 𝒩ϕ77.5ℳ3.5β1 and 𝒩ϕ77.5ℳ10β1 models under both Mp and MB particle injection approaches. These jets have the same magnetic pitch angle as those with lower relative knot intensities, but differ in their lower magnetization (β = 1), which implies a higher relative intensity of recollimation shocks and a wider amplitude of the radial oscillations (see again Tables 4 and 5 and the discussion related to Eq. (20) in Sect. 5 of Paper I).
Regarding the particle injection approximation, emitting models computed following Mp usually have more intense knots than their MB counterparts, except for models 𝒩ϕ45ℳ10β17.5 and 𝒩ϕ45ℳ10β1, especially the last one, which systematically presents about 7% more intense knots at all viewing angles than its Mp counterpart. Again, the differences between the two emission approaches are related to the relative strength of the jumps at shocks and the variations at radial oscillations, specifically, those of the gas pressure in the Mp approach and those of the magnetic energy (magnetic pressure) in the MB approach. Models 𝒩ϕ45ℳ10β17.5 and 𝒩ϕ45ℳ10β1 have the largest difference between changes in the thermal and magnetic pressures along the jet (see Tables 4 and 5 in Paper I).
7. Polarized emission
As discussed in Sects. 2 and 3 of Paper I, the jet models computed in this work preserve the axial symmetry and helical geometry of the magnetic field of those computed in Fuentes et al. (2018). We therefore obtained the characteristic bimodal configuration of the polarization angle throughout the jets, whether perpendicular to or aligned with the jet propagation direction (Lyutikov et al. 2005). We recall that this distribution indicates which component of the magnetic field, projected over the plane of the sky, dominates the other. We find the electric vector position angles (EVPAs) perpendicular (∼0°) or parallel (∼90°) to the jet axis if the projected poloidal or toroidal component dominates, respectively. The new magnetic field configurations explored in this work reveal a remarkable difference in the polarized emission of jets with different magnetic pitch angles. This is particularly clear in Fig. 7, which shows the median polarization angle (and its variability) across the 𝒩ϕ45, 𝒩ϕ77.5, and ℱϕ77.5 jet models for different viewing angles and the two particle injection approaches. Median polarization angles for model Mp are only shown for θ = 20° because there are no qualitative differences with model MB for lower values of the viewing angle (see the linearly polarized intensity maps in Figs. 1–3).
 |
Fig. 7. Median polarization angle across all jet models and viewing angles θ = 2°, 5°, 10°, and 20°, for the particle injection model MB (median polarization angles for model Mp are only shown for θ = 20° because there are no qualitative differences with model MB for lower values of the viewing angle; see the linearly polarized intensity maps in Figs. 1–3). Shaded regions represent the median absolute deviation of each model. Thin dashed lines represent the integrated polarized intensity (normalized). Models were smoothed for the computations through a convolution with a beam of size 0.5 Rj FWHM. Abscissa axis units as in Fig. 5. |
The magnetic pitch angle ϕB, the viewing angle θ, and their transformations from the fluid into the observer frame through the Lorentz factor Γ are the main drivers determining the imprints of the polarized emission that is radiated by the jet models. The following results therefore apply for an average Lorentz factor of 3.2 (value at injection). Fuentes et al. (2018) showed that for viewing angles up to θ = 5°, the 𝒩ϕ45 models (ϕB = 45°) still display some signatures of the toroidal magnetic field component. This result is seen in the plots of the polarization angle for 𝒩ϕ45 models at θ = 2°, 5° displayed in Fig. 7, together with an increasing variability of the EVPAs with θ (especially in models ℳ10β1 and ℳ10β17.5). For larger viewing angles, the projected poloidal component of the magnetic field dominates and the EVPA profiles remain perpendicular to the jet axis. On the other hand, with a magnetic pitch angle of ϕB = 77.5° and hence a larger contribution of the toroidal magnetic field component, the 𝒩ϕ77.5 and ℱϕ77.5 jet models exhibit a persistent EVPA bimodal structure not only for the viewing angle θ = 2°, but also for θ = 5° and 10° (some of them even at 20°). At small viewing angles, a central region of EVPAs aligned with the jet propagation direction defines a bright spine of polarized emission, which is progressively widened and displaced to the bottom of the jets as θ increases, especially for 𝒩ϕ77.5, and to a lower extent, for ℱϕ77.5 models. This toroidal spine is recovered and centered around the jet axis again at θ = 20° (with large variabilities in the polarization angles) for all 𝒩ϕ77.5 models under the MB approximation, and for ℳ3.5β1 and ℳ10β1 models alone (jet models in equipartition) under the Mp approximation. However, despite the median polarization angle results, a closer look at the maps in Fig. 4 for these models and viewing angle reveals an irregular toroidal spine that is mainly defined between stationary knots. At the location of the stationary components, the EVPAs turn perpendicular, thus describing a rotation along the jet axis. This is more evident as the number of stationary knots decreases and therefore, model 𝒩ϕ77.5ℳ10β1 under both injection approximations is the best example of this longitudinal polarization angle rotation (see Fig. 4). In contrast to their non-force-free counterparts, ℱϕ77.5 models show no trace of the projected toroidal component at this viewing angle.
Regarding the degree of linear polarization, Π, the differences between 𝒩ϕ45, 𝒩ϕ77.5, and ℱϕ77.5 models are also significant, especially for a viewing angle of θ = 20°. The bottom panels of Figs. 5a and b show that the distribution of Π across the jet for a viewing angle of 2° is similar for the three families of models. It is more chaotic in the 𝒩ϕ45 case and is qualitatively axisymmetric in the 𝒩ϕ77.5 and ℱϕ77.5 cases. Nonetheless, at a viewing angle of 20°, these three sets of models differ considerably from each other. The 𝒩ϕ45 models present an overall large degree of linear polarization and a flat profile with a mild depression around the jet axis for the two particle acceleration approximations. In contrast, the degree of linear polarization in the 𝒩ϕ77.5 models experiences a large drop toward the center for the Mp and MB approximations, plus a moderate bump at the axis in the last case. The degree of linear polarization of the ℱϕ77.5 models displays a similar drop to that of the 𝒩ϕ77.5 models, but a larger bump. In addition, all models regardless of the magnetic pitch angle and particle injection approximation coincide in their higher values of Π at the jet edges, as expected for jets threaded by a helical magnetic field and reported by Gómez et al. (2008) for the jet of the radio galaxy 3C 120.
In order to compare these polarization signatures with actual VLBI observations, we convolved our models with two different beams, one with a size of half the jet models radius, which can resolve the jets transversally and simulates high angular resolution observations, and another with the size of the jet diameter, which cannot resolve the fine structure of the models and is typical of centimeter–wavelength observations. The jet length was restricted to that where integration columns of the emission code are complete, that is, where they pass through the entire jet width, to avoid incomplete emitting regions at the jet ends, which can induce interpretation errors. Figure 8 shows the linearly polarized intensity (P) and degree of polarization (Π) of the jet models 𝒩ϕ45ℳ10β1 and 𝒩ϕ77.5ℳ10β1 convolved with the two beams described above (0.5 Rj and 2 Rj FWHM) and for the viewing angles θ = 5°, 10°, and 20°. The panels are split into two halves, displaying P and Π on the left and right sides, respectively, because the models are qualitatively symmetric with respect to the dividing white line. These two models were selected for the figure because their lower number of stationary knots and more extended emission (MB approximation) allowed us to better distinguish the effects of the convolution, although all models were convolved for the study.
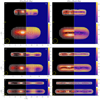 |
Fig. 8. Linearly polarized intensity and degree of linear polarization (left and right halves of each panel, respectively) of the jet models 𝒩ϕ45ℳ10β1 and 𝒩ϕ77.5ℳ10β1, convolved with two different beams for viewing angles of 5° (top), 10° (middle), and 20° (bottom) and computed following the particle injection model MB. The linear polarization intensity is plotted in normalized units and follows a linear color scale. Color bars at the right of each panel show the scale for the degree of linear polarization at the corresponding panel. The total intensity is superimposed as contours from 5 × 0.5% to 90% of the total intensity peak, following the sequence cn = (3/2)×cn − 1. The beam sizes (lower left corner of each panel) are ∼0.5 Rj and 2 Rj FWHM. EVPAs are displayed as white bars. |
For both beam sizes, the 𝒩ϕ45 model essentially retains its polarization angle distribution throughout the jet because it is constantly perpendicular to the axis, with the exception of θ = 5°, for which the large beam removes some traces of EVPA rotation at the bottom part of the jet, which is still resolved by the high angular resolution beam. These results apply for all 𝒩ϕ45 models. The 𝒩ϕ77.5 model, in contrast, features a rich structure for all viewing angles. At θ = 5° and 10°, the transition zone between regions with EVPAs perpendicular to and aligned with the jet propagation direction, where the linearly polarized intensity drops, is enhanced by the convolution, mainly in the unresolved case, forming two bright polarized limbs of orthogonal polarization angles. This structure is persistent regardless of the beam size in the non-force-free models, while the high magnetic tension of the force-free models and the emission asymmetry still present at these values of θ confines their polarized emission above the jet axis, which causes the bottom part of these jets, in which the projected toroidal component dominates, to radiate with low intensity (see ℱϕ77.5 models in Fig. 7). VLBI observations of blazar jets performed either at centimeter- or millimeter-wavelengths, which usually span viewing angles up to 10°, should feature this bimodal EVPA structure if the jets magnetic pitch angle is about 77.5° and the dynamic range is large enough (∼1:100). For a viewing angle of 20°, the transverse bimodality of the polarization angle is lost because in this case, it is amplified by the convolution the longitudinal polarization angle rotation, as we mentioned before, with EVPAs perpendicular to the jet axis over stationary knots and parallel between them. This change in the EVPA is the consequence of the strengthening of the poloidal component of the magnetic field when the (highly oblique) shocks associated with the knots are crossed, as can be seen in the panel of the axial magnetic field of model 𝒩ϕ77.5ℳ10β1 in Fig. 6 and in the drop of the averaged magnetic pitch angle for the same model in Fig. 7 of Paper I. We note that in contrast to our result, Beuchert et al. (2018) reported parallel EVPAs at an alleged recollimation shock at 3 mas from the core of the radio galaxy 3C 111. However, as remarked by the authors, the aligned EVPAs at the recollimation shock in the case of 3C 111 could likely be the result of the interaction with a traveling shock, which may enhance the toroidal field component.
8. Summary and conclusions
Synthetic polarized synchrotron emission maps were obtained from the magnetohydrodynamical simulations presented in Paper I based on two models connecting the thermal particles population, modeled by the hydrodynamical code, and the nonthermal particle population, which is responsible for the synchrotron radiation (see Sect. 3). Our results can be of interest in the interpretation of the VLBI observations of blazar jets. We list the results below.
-
(i)
The helical geometry of the magnetic field leaves a clear imprint on the emission models, which manifests itself in an asymmetry in the emission across the jet for small enough viewing angles. This cross-section emission asymmetry, caused by the change of the angle between the helical magnetic field and the line of sight across the jet (Aloy et al. 2000; Lyutikov et al. 2005; Clausen-Brown et al. 2011; Fuentes et al. 2018), is confirmed in all the models discussed in this paper and for both particle injection approximations, as expected from the purely geometrical origin of the effect, for viewing angles < 10°. The emission asymmetry manifests itself in total and linearly polarized synchrotron intensities, although the transversal profiles for the polarized emission are much more complex.
-
(ii)
As concluded in Paper I, magnetic tension and the radial component of the Lorentz force are the key parameters governing the transversal structure of jets. It is then expected that these two quantities leave their imprints on the synchrotron emission maps obtained with the two particle injection models. Because of their higher relative magnetic tension and radial Lorentz force, in the models with the largest magnetizations and/or magnetic pitch angles, the uneven distribution of internal energy translates into a spine brightening in total and polarized intensities. Force-free models display a distinct spine brightening that originates from the radial gradient of the axial magnetic field.
-
(iii)
If the radio knots often observed in these jets are associated with recollimation shocks in the underlying flow, jets with strong radio knots must correspond to hot jets with low magnetization (at about or below equipartition). This conclusion, which was already established in Martí et al. (2016) and Fuentes et al. (2018), is now corroborated for a wider sample of models with different magnetic pitch angles and helical magnetic fields corresponding to force-free and non-force-free configurations. The strength of the shocks in these sources tends to decrease with decreasing internal energy and increasing magnetization in the small and large magnetic pitch angle jets and force-free and non-force-free jets. In addition to this and as a new result, jets with prominent radio knots must have a moderately small magnetic pitch angle because the magnetic tension tends to damp the strength of recollimation shocks.
-
(iv)
The jet models computed in this work preserve the axial symmetry and helical geometry of the magnetic field. We therefore obtain the characteristic bimodal configuration of the polarization angle throughout the jets, whether perpendicular to or aligned with the jet propagation direction (Lyutikov et al. 2005). Blazar jets with large magnetic pitch angles should feature two bright limbs of linearly polarized emission with orthogonal EVPAs between them, tracing the poloidal and toroidal components of the magnetic field, regardless of the angular resolution achieved in the observations. Jets observed with large viewing angles could display EVPA rotation along the propagation direction if the jet is in equipartition and the polarized emission is not strongly confined around the jet axis. Conversely, if the magnetic pitch angle is about 45°, only jets with viewing angles up to ∼2° will present some clear signatures of a toroidal magnetic field component. Beyond this value, EVPAs will remain perpendicular to the jet axis, with the exception of some variations at recollimation shocks.
-
(v)
Jets with moderately open viewing angles will present a higher degree of linearly polarized emission values at the edges. As the magnetic pitch angle increases, the drop in the polarization degree toward the jet axis will also increase, featuring a bump of variable intensity depending on the connection of thermal and nonthermal particle populations.
Our conclusions are limited by the imposed axisymmetry and stationarity of the magnetohydrodynamical models, the simplicity of the flat-topped axial velocity profile, and the absence of rotation, among other important simplifications, as the nature of the numerical approach used to compute the magnetohydrodynamical models, which is only valid in the relativistic limit and is not suitable for describing jet models with extended (subrelativistic) shear layers and the resulting observational phenomenology associated with them. However, despite all the limitations of the dynamical and emission simulations, our approach allows for a thorough study of wide regions of the parameter space defining AGN jets at parsec scales, aiming to understand the origin of their observational phenomenology. Following the line of thought started in Fuentes et al. (2018), in this paper we extended the original study to wide ranges of magnetosonic Mach number, internal energies, and magnetizations to models with larger magnetic pitch angles and force-free magnetic field configurations.
Acknowledgments
AF and JLG acknowledge financial support from the Spanish Ministerio de Economía y Competitividad (grants AYA2016-80889-P, PID2019-108995GB-C21), the Consejería de Economía, Conocimiento, Empresas y Universidad of the Junta de Andalucía (grant P18-FR-1769), the Consejo Superior de Investigaciones Científicas (grant 2019AEP112), and the State Agency for Research of the Spanish MCIU through the Center of Excellence Severo Ochoa award for the Instituto de Astrofísica de Andalucía (SEV-2017-0709). JMM and MP acknowledge financial support from the Spanish Ministerio de Economía y Competitividad (grant AYA2016-77237-C3-3-P), the Spanish Ministerio de Ciencia (PID2019-107427GB-C33), and from the local Autonomous Government (Generalitat Valenciana, grant PROMETEO/2019/071). JMM acknowledges further financial support from the Spanish Ministerio de Economía y Competitividad (grant PGC2018-095984-B-I00). MP acknowledges further financial support from the Spanish Ministerio de Ciencia through grant PID2019-105510GB-C31. This research made use of Python (http://www.python.org), Numpy (van der Walt et al. 2011), Pandas (McKinney et al. 2010), and Matplotlib (Hunter 2007). We also made use of Astropy (http://www.astropy.org), a community-developed core Python package for Astronomy (Astropy Collaboration 2013, 2018).
References
- Aloy, M.-A., Gómez, J.-L., Ibáñez, J.-M., Martí, J.-M., & Müller, E. 2000, ApJ, 528, L85 [Google Scholar]
- Astropy Collaboration (Robitaille, T. P., et al.) 2013, A&A, 558, A33 [NASA ADS] [CrossRef] [EDP Sciences] [Google Scholar]
- Astropy Collaboration (Price-Whelan, A. M., et al.) 2018, AJ, 156, 123 [Google Scholar]
- Beuchert, T., Kadler, M., Perucho, M., et al. 2018, A&A, 610, A32 [NASA ADS] [CrossRef] [EDP Sciences] [Google Scholar]
- Broderick, A. E., & McKinney, J. C. 2010, ApJ, 725, 750 [Google Scholar]
- Clausen-Brown, E., Lyutikov, M., & Kharb, P. 2011, MNRAS, 415, 2081 [Google Scholar]
- Fuentes, A., Gómez, J. L., Martí, J. M., & Perucho, M. 2018, ApJ, 860, 121 [Google Scholar]
- Gómez, J. L., Alberdi, A., & Marcaide, J. M. 1993, A&A, 274, 55 [NASA ADS] [Google Scholar]
- Gómez, J. L., Alberdi, A., & Marcaide, J. M. 1994a, A&A, 284, 51 [Google Scholar]
- Gómez, J. L., Alberdi, A., Marcaide, J. M., Marscher, A. P., & Travis, J. P. 1994b, A&A, 292, 33 [NASA ADS] [Google Scholar]
- Gómez, J. L., Martí, J. M. A., Marscher, A. P., Ibáñez, J. M. A., & Marcaide, J. M. 1995, ApJ, 449, L19 [Google Scholar]
- Gómez, J. L., Martí, J. M., Marscher, A. P., Ibáñez, J. M., & Alberdi, A. 1997, ApJ, 482, L33 [NASA ADS] [CrossRef] [Google Scholar]
- Gómez, J. L., Marscher, A. P., Jorstad, S. G., Agudo, I., & Roca-Sogorb, M. 2008, ApJ, 681, L69 [Google Scholar]
- Hunter, J. D. 2007, Comput. Sci. Eng., 9, 90 [NASA ADS] [CrossRef] [Google Scholar]
- Jorstad, S. G., Marscher, A. P., Morozova, D. A., et al. 2017, ApJ, 846, 98 [NASA ADS] [CrossRef] [Google Scholar]
- Kirk, J. G., Guthmann, A. W., Gallant, Y. A., & Achterberg, A. 2000, ApJ, 542, 235 [NASA ADS] [CrossRef] [Google Scholar]
- Komissarov, S. S., & Falle, S. A. E. G. 1997, MNRAS, 288, 833 [NASA ADS] [CrossRef] [Google Scholar]
- Komissarov, S. S., Porth, O., & Lyutikov, M. 2015, Comput. Astrophys. Cosmol., 2, 9 [Google Scholar]
- Lyubarsky, Y. E. 2005, MNRAS, 358, 113 [NASA ADS] [CrossRef] [Google Scholar]
- Lyutikov, M., Pariev, V. I., & Gabuzda, D. C. 2005, MNRAS, 360, 869 [Google Scholar]
- Martí, J.-M. 2019, Galaxies, 7, 24 [Google Scholar]
- Martí, J. M., Perucho, M., & Gómez, J. L. 2016, ApJ, 831, 163 [Google Scholar]
- McKinney, W. 2010, in Proceedings of the 9th Python in Science Conference, eds. S. van der Walt, & J. Millman, 51 [Google Scholar]
- Moya-Torregrosa, I., Fuentes, A., Martí, J. M., et al. 2021, A&A, 650, A60 (Paper I) [EDP Sciences] [Google Scholar]
- Porth, O., Fendt, C., Meliani, Z., & Vaidya, B. 2011, ApJ, 737, 42 [Google Scholar]
- Sironi, L., Petropoulou, M., & Giannios, D. 2015, MNRAS, 450, 183 [Google Scholar]
- van der Walt, S., Colbert, S. C., & Varoquaux, G. 2011, Comput. Sci. Eng., 13, 22 [Google Scholar]
- Zakamska, N. L., Begelman, M. C., & Blandford, R. D. 2008, ApJ, 679, 990 [Google Scholar]
All Tables
All Figures
|
Fig. 1. Total intensity (I), linearly polarized intensity (P), with EVPAs overplotted as black bars, and degree of linear polarization (Π) of the 𝒩ϕ77.5 and ℱϕ77.5 jet models, computed for the two particle injection approximations (Mp and MB) and a viewing angle of 2°. Total and polarized intensity values are normalized to unity. Axis units represent the distance in jet radius units. |
| In the text | |
 |
Fig. 2. Same as Fig. 1, but for a viewing angle of 5°. |
| In the text | |
 |
Fig. 3. Same as Fig. 1, but for a viewing angle of 10°. |
| In the text | |
 |
Fig. 4. Same as Fig. 1, but for a viewing angle of 20°. |
| In the text | |
|
Fig. 5. a: total intensity (I), linearly polarized intensity (P), and degree of linear polarization (Π) integrated transverse profiles of the 𝒩ϕ45 and 𝒩ϕ77.5 jet models, computed for viewing angles θ = 2° (left) and 20° (right), and for the particle injection model Mp. Models with equal color but different line style differ only in the magnetic pitch angle value. Total and linearly polarized intensity values are normalized to unity. The negative and positive values of the abscissa axes represent the bottom and top halves of the jets (assuming they propagate horizontally from left to right), expressed in jet radius units, respectively. b: same panel distribution as above, but computed following the particle injection model MB, which includes the ℱϕ77.5 jet models. |
| In the text | |
|
Fig. 6. Relative intensity of the stationary knots, measured as the integrated total intensity percentage corresponding to knots when the underlying jet emission is removed. Calculations are made for viewing angles θ = 5°, 10°, and 20° and the two particle injection methods, Mp and MB, shown as solid and dashed lines, respectively. ℱϕ77.5 models are drawn as dot-dashed lines. |
| In the text | |
|
Fig. 7. Median polarization angle across all jet models and viewing angles θ = 2°, 5°, 10°, and 20°, for the particle injection model MB (median polarization angles for model Mp are only shown for θ = 20° because there are no qualitative differences with model MB for lower values of the viewing angle; see the linearly polarized intensity maps in Figs. 1–3). Shaded regions represent the median absolute deviation of each model. Thin dashed lines represent the integrated polarized intensity (normalized). Models were smoothed for the computations through a convolution with a beam of size 0.5 Rj FWHM. Abscissa axis units as in Fig. 5. |
| In the text | |
|
Fig. 8. Linearly polarized intensity and degree of linear polarization (left and right halves of each panel, respectively) of the jet models 𝒩ϕ45ℳ10β1 and 𝒩ϕ77.5ℳ10β1, convolved with two different beams for viewing angles of 5° (top), 10° (middle), and 20° (bottom) and computed following the particle injection model MB. The linear polarization intensity is plotted in normalized units and follows a linear color scale. Color bars at the right of each panel show the scale for the degree of linear polarization at the corresponding panel. The total intensity is superimposed as contours from 5 × 0.5% to 90% of the total intensity peak, following the sequence cn = (3/2)×cn − 1. The beam sizes (lower left corner of each panel) are ∼0.5 Rj and 2 Rj FWHM. EVPAs are displayed as white bars. |
| In the text | |
Current usage metrics show cumulative count of Article Views (full-text article views including HTML views, PDF and ePub downloads, according to the available data) and Abstracts Views on Vision4Press platform.
Data correspond to usage on the plateform after 2015. The current usage metrics is available 48-96 hours after online publication and is updated daily on week days.
Initial download of the metrics may take a while.