Fig. 10.
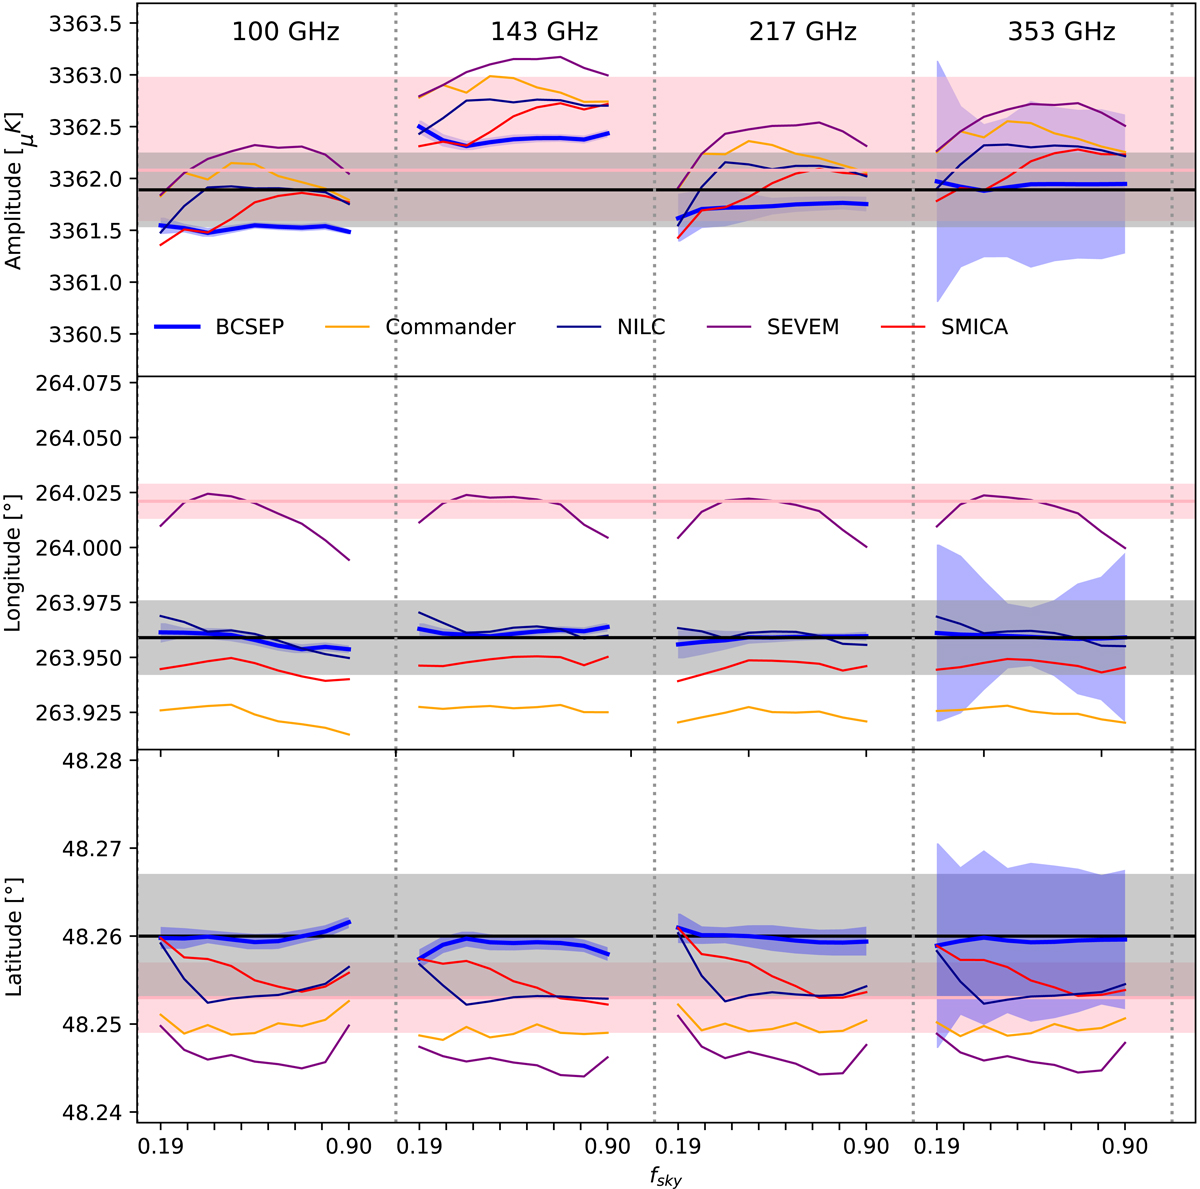
Variation of the solar dipole parameters (in rows) for different frequency bands (in columns) as a function of the Galactic mask in which the dipole is fitted. The black lines and gray band uncertainties show the final results of this work, using the Bcsep CMB anisotropies map. For reference, the pink lines and bands show the HFI-Legacy measurements. The four Planck Legacy CMB anisotropies maps are also tested, and are shown color coded.
Current usage metrics show cumulative count of Article Views (full-text article views including HTML views, PDF and ePub downloads, according to the available data) and Abstracts Views on Vision4Press platform.
Data correspond to usage on the plateform after 2015. The current usage metrics is available 48-96 hours after online publication and is updated daily on week days.
Initial download of the metrics may take a while.