Fig. 7.
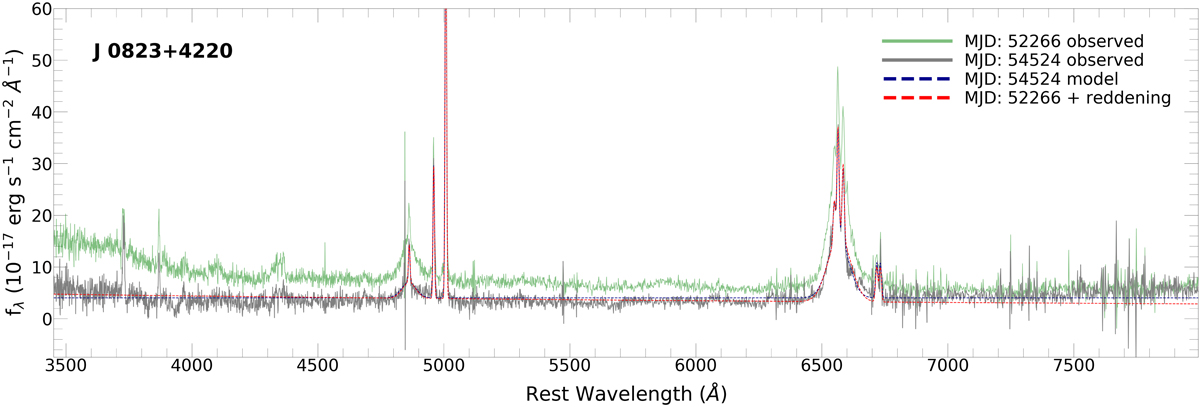
Comparison of the reddened bright-state spectrum with the directly fitted dim-state spectrum for the CLQ J0823+4220. The dim- (grey curve) and bright-state (green curve) observed spectra are shown. We reddened the fitted components (as per Sect. 3.4.3) of the bright-state spectrum to fit the dim-state spectrum. This produced the red, dashed curve with a best-fit E(B − V) = 0.176. We also show the spectral components fitted directly to the dim-state spectrum as the blue, dashed curve for comparison.
Current usage metrics show cumulative count of Article Views (full-text article views including HTML views, PDF and ePub downloads, according to the available data) and Abstracts Views on Vision4Press platform.
Data correspond to usage on the plateform after 2015. The current usage metrics is available 48-96 hours after online publication and is updated daily on week days.
Initial download of the metrics may take a while.