Fig. 6.
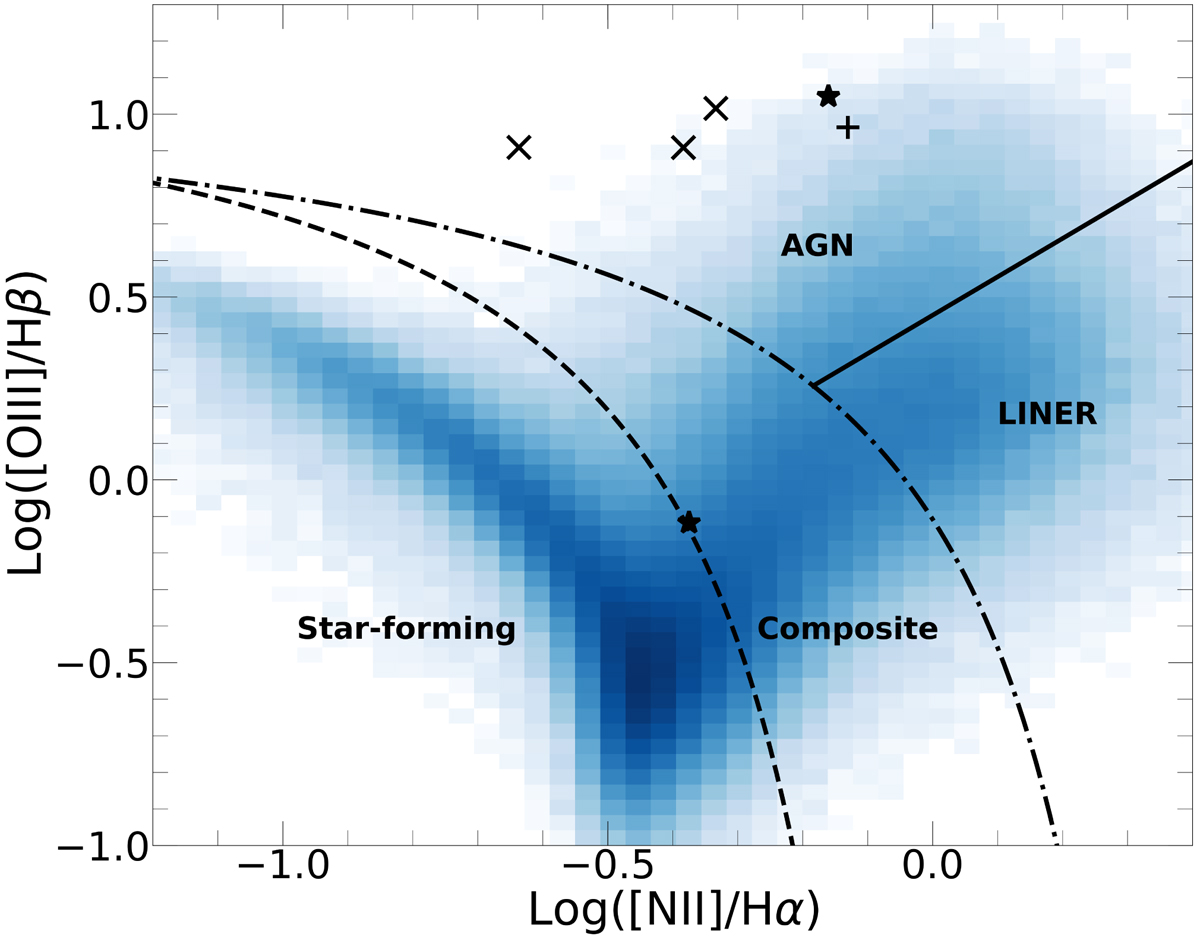
BPT diagram showing the narrow emission line ratios of the six CLQs, three turning on (cross) and two turning off (star), and one turning off then on (plus). The heat map was produced using the MPA-JHU emission line analysis of 927 552 DR7 objects, thereby showing the overall SDSS trend (Brinchmann et al. 2004). Three emission line classification schemes are shown. Kauffmann et al. (2003) (dashed line) separates star-forming and composite host galaxies, Kewley et al. (2006) (dotted line) separates AGN and composite host galaxies, and Schawinski et al. (2007) separates LINERs from AGN.
Current usage metrics show cumulative count of Article Views (full-text article views including HTML views, PDF and ePub downloads, according to the available data) and Abstracts Views on Vision4Press platform.
Data correspond to usage on the plateform after 2015. The current usage metrics is available 48-96 hours after online publication and is updated daily on week days.
Initial download of the metrics may take a while.