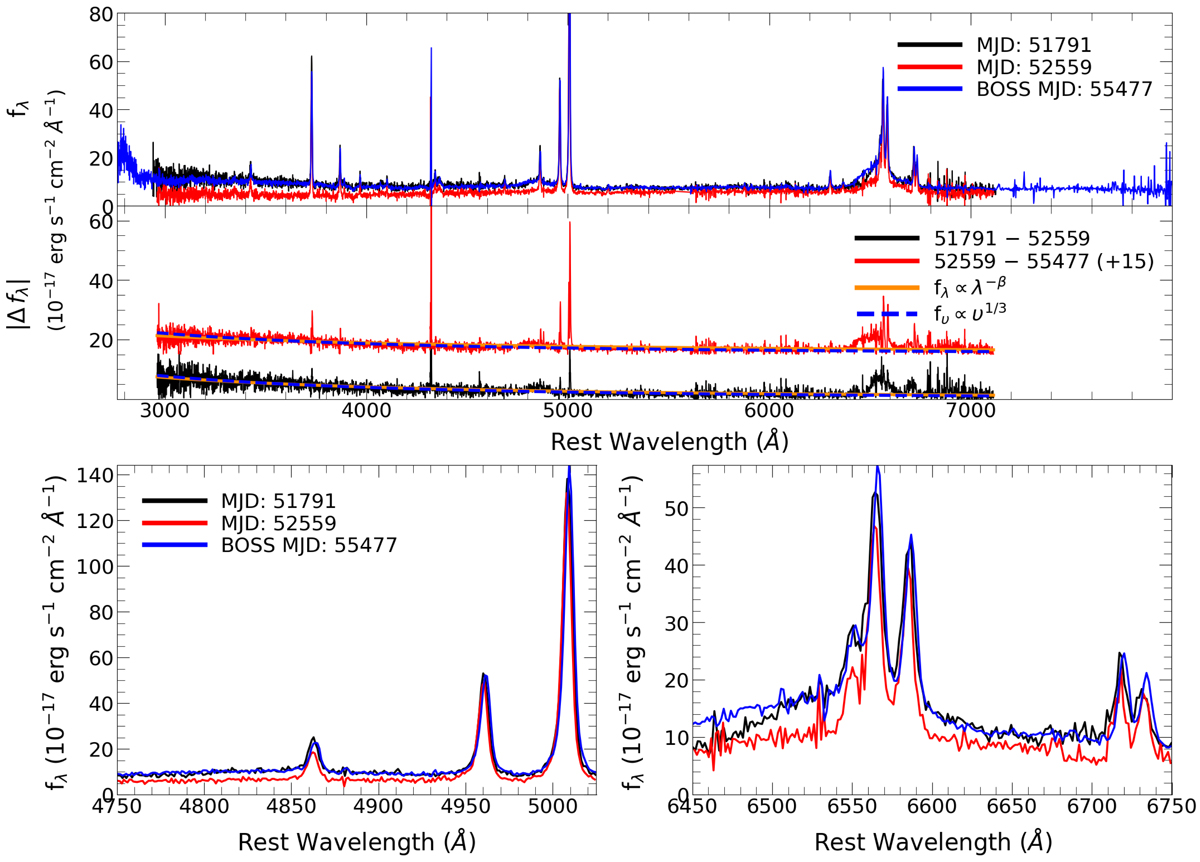
Fig. 3.

Observed spectra and the difference spectra of the turning off and on CLQ J0002-0027. Top: the three observed spectra, including the extra BOSS spectrum (blue curve), are shown in the SDSS Legacy rest wavelength range of the object. The epochs for the black, red, and blue spectra are MJD = 51791, 52559, and 55477, respectively. Middle: the difference spectra of the first and second epoch (black curve), and the second and third epoch (red) are shown on the same flux scale, with a constant added to the latter. Bottom: a zoomed in view of the observed spectra in the Hβ (left) and Hα (right) regions is shown.
Current usage metrics show cumulative count of Article Views (full-text article views including HTML views, PDF and ePub downloads, according to the available data) and Abstracts Views on Vision4Press platform.
Data correspond to usage on the plateform after 2015. The current usage metrics is available 48-96 hours after online publication and is updated daily on week days.
Initial download of the metrics may take a while.


