Fig. 1.
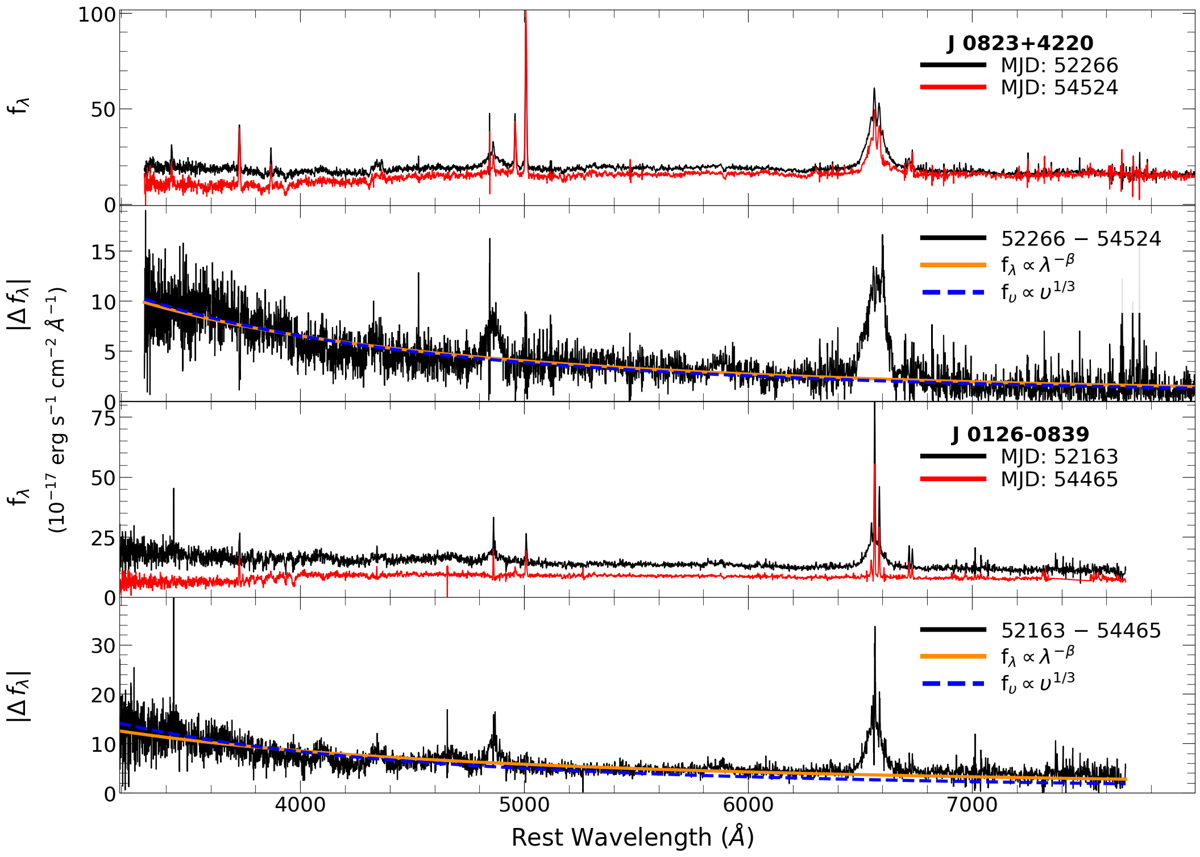
Observed spectra and the difference spectrum of the turning off CLQs. The quasars shown are J0823+4220 (top two panels), and J0126–0839 (bottom two panels). Upper: the observed optical spectra, with the first epoch (black) and second epoch (red) both shown. Lower: the difference spectrum |Δfλ| (black) is shown, demonstrating how the CLQs were identified, and the resemblance of the variable component to an accretion disc. A fitted Shakura-Sunyaev accretion disc power law fυ ∝ υ1/3 (dashed-blue) and a best-fit power law to the continuum (orange) is shown.
Current usage metrics show cumulative count of Article Views (full-text article views including HTML views, PDF and ePub downloads, according to the available data) and Abstracts Views on Vision4Press platform.
Data correspond to usage on the plateform after 2015. The current usage metrics is available 48-96 hours after online publication and is updated daily on week days.
Initial download of the metrics may take a while.