Fig. 9.
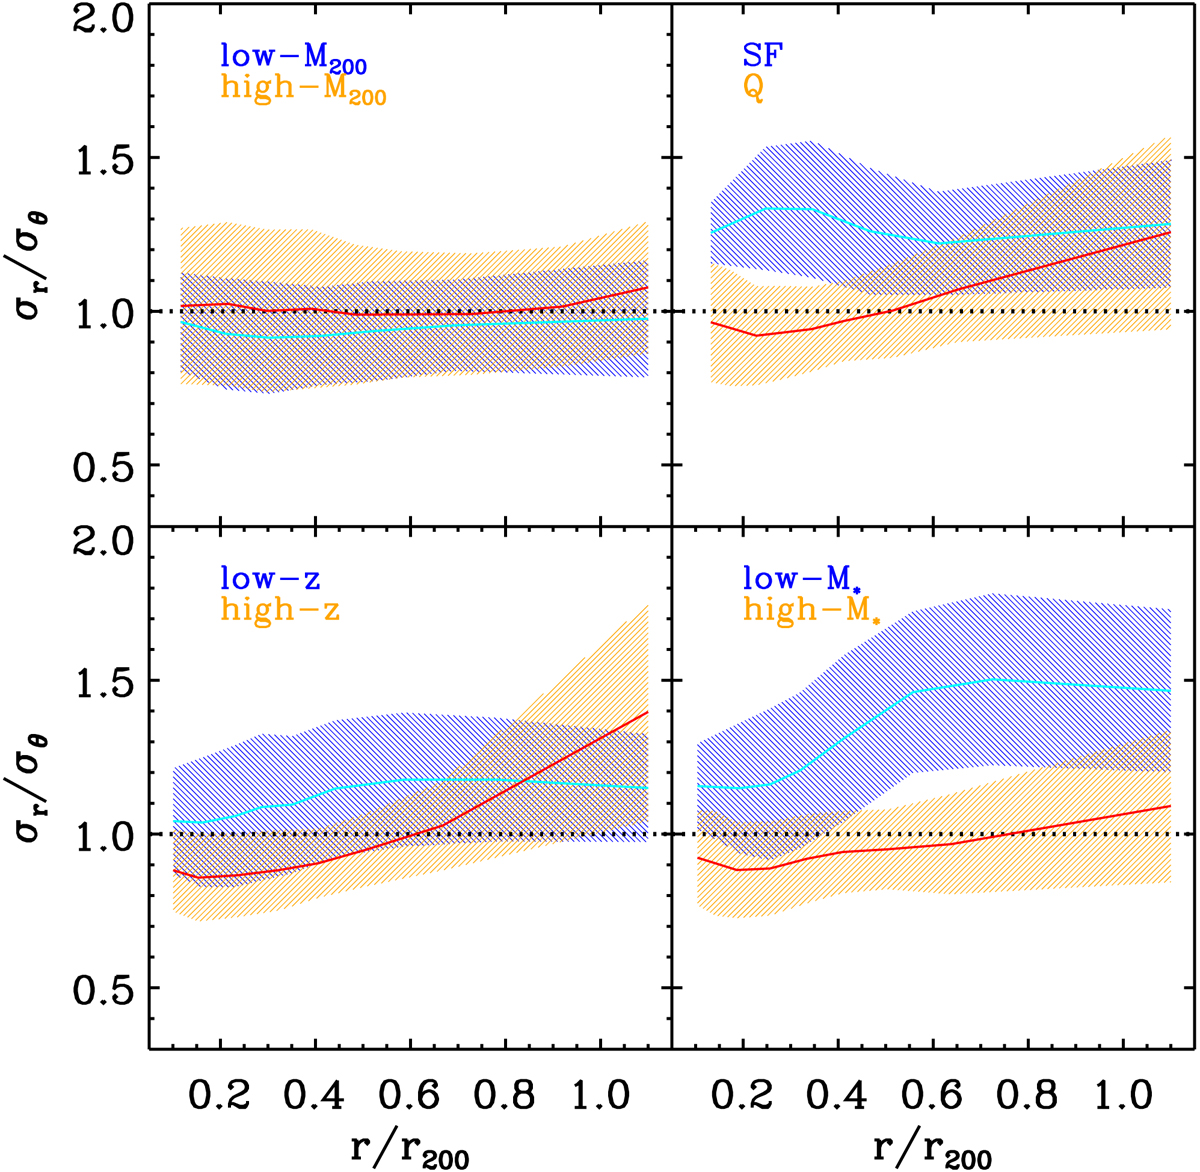
Velocity anisotropy profiles (σr/σθ)(r) for several subsamples. Confidence intervals are 1σ. Upper left panel: low-M200 (cyan line, blue shading) and high-M200 (red line, orange shading). Lower left panel: low-z (cyan line, blue shading) and high-z (red line, orange shading). Upper right panel: star-forming galaxies (cyan line, blue shading) and quiescent galaxies (red line, orange shading) in the ensemble sample. Lower right panel: 9.5 ≤ log M⋆/M⊙ < 10.5 galaxies (cyan line, blue shading) and log M⋆/M⊙ ≥ 10.5 galaxies (red line, orange shading) in the ensemble sample.
Current usage metrics show cumulative count of Article Views (full-text article views including HTML views, PDF and ePub downloads, according to the available data) and Abstracts Views on Vision4Press platform.
Data correspond to usage on the plateform after 2015. The current usage metrics is available 48-96 hours after online publication and is updated daily on week days.
Initial download of the metrics may take a while.