Free Access
Fig. 7.
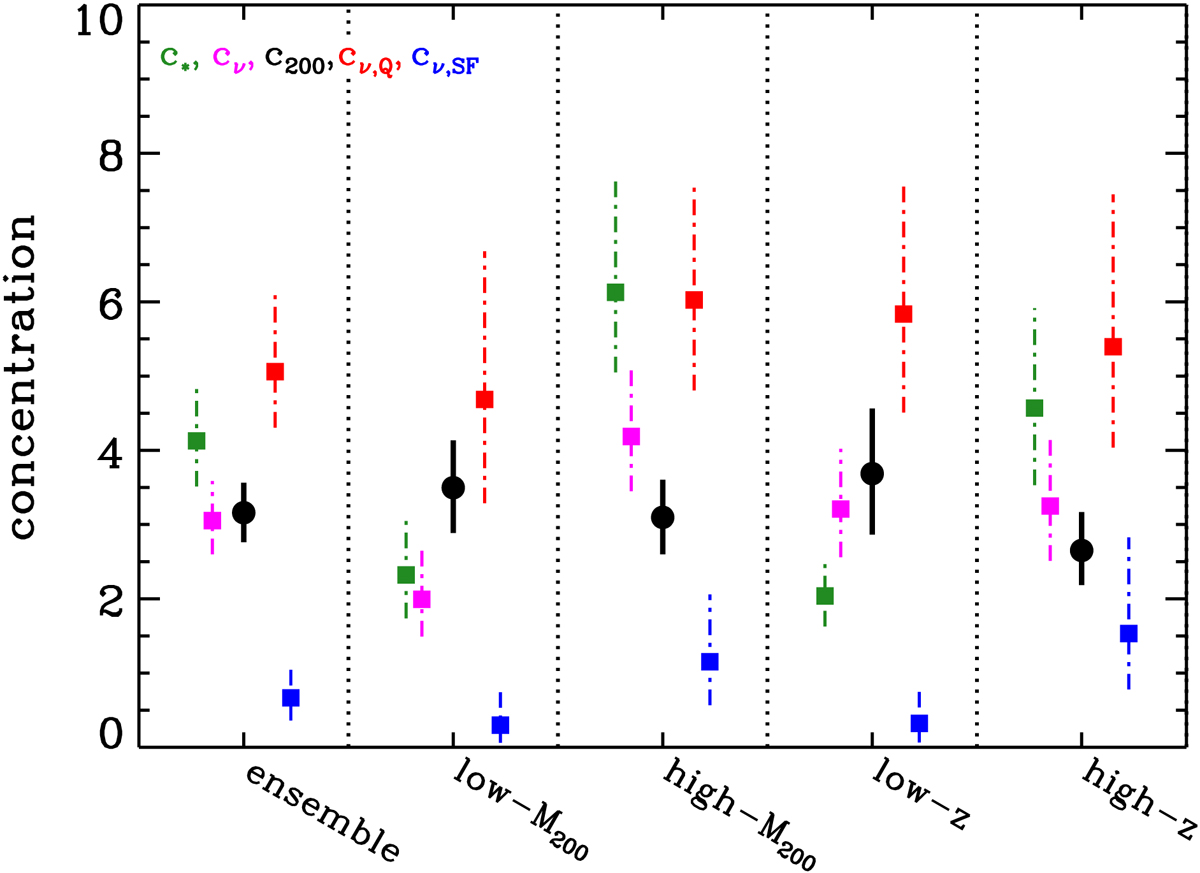
Concentrations (c200) for the ensemble cluster and its subsamples (black dots with 1σ error bars). The green, magenta, red, and blue squares with dot-dashed 1σ error bars represent c⋆, cν, cν, Q, and cν, SF, respectively.
Current usage metrics show cumulative count of Article Views (full-text article views including HTML views, PDF and ePub downloads, according to the available data) and Abstracts Views on Vision4Press platform.
Data correspond to usage on the plateform after 2015. The current usage metrics is available 48-96 hours after online publication and is updated daily on week days.
Initial download of the metrics may take a while.