Free Access
Fig. 4.
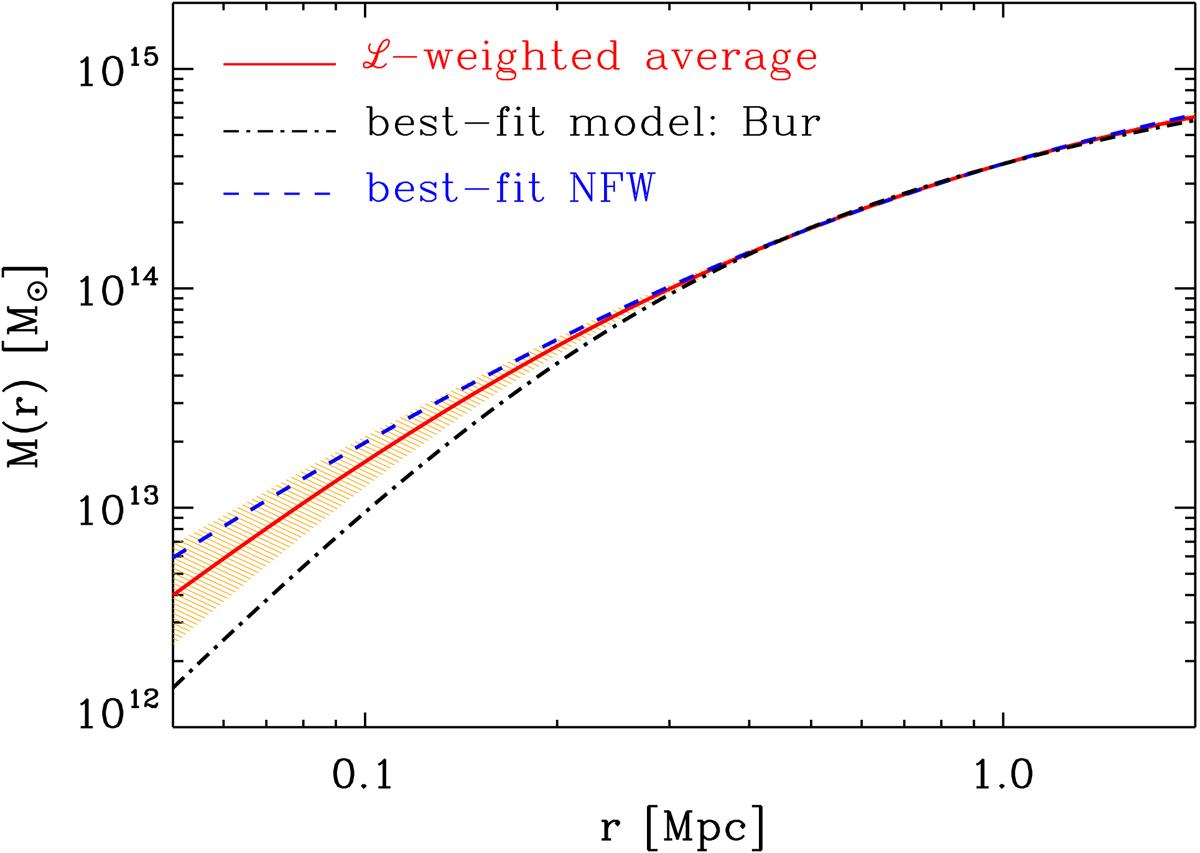
MAMPOSSt results for the M(r) of the ensemble cluster. Red curve and orange shading: ℒ-weighted average of all 35 best-fit model M(r) from the MAMPOSSt analysis, and 1σ error. Blue dashed curve: highest-ℒ among NFW models. Black dot-dashed curve: highest-ℒ model (Burkert).
Current usage metrics show cumulative count of Article Views (full-text article views including HTML views, PDF and ePub downloads, according to the available data) and Abstracts Views on Vision4Press platform.
Data correspond to usage on the plateform after 2015. The current usage metrics is available 48-96 hours after online publication and is updated daily on week days.
Initial download of the metrics may take a while.