Fig. 10.
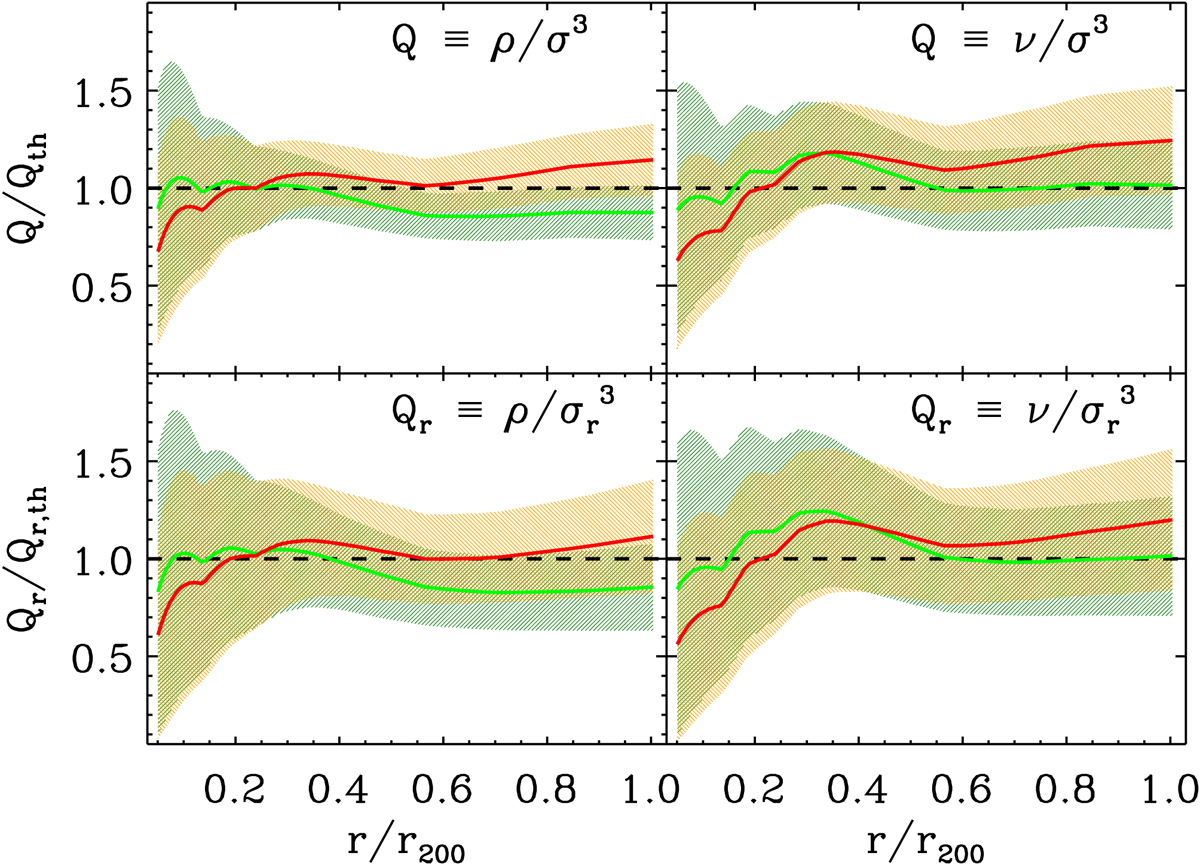
The pseudo phases-space density profiles of the ensemble cluster. The solid lines show Q(r) and Qr(r) of the ensemble cluster (top and bottom panels, respectively) derived from the total mass density profile ρ(r) and the number density profile ν(r) (left and right panels, respectively), divided by power laws of the radius Qth ∝ r−1.84 and Qr,th ∝ r−1.92 (green line and shadings) or by power laws Qth ∝ r−2.02 and Qr,th ∝ r−2.11 (red line and orange shading). The shadings indicate 1σ uncertainties. The dashed black line is unity.
Current usage metrics show cumulative count of Article Views (full-text article views including HTML views, PDF and ePub downloads, according to the available data) and Abstracts Views on Vision4Press platform.
Data correspond to usage on the plateform after 2015. The current usage metrics is available 48-96 hours after online publication and is updated daily on week days.
Initial download of the metrics may take a while.