Fig. 7
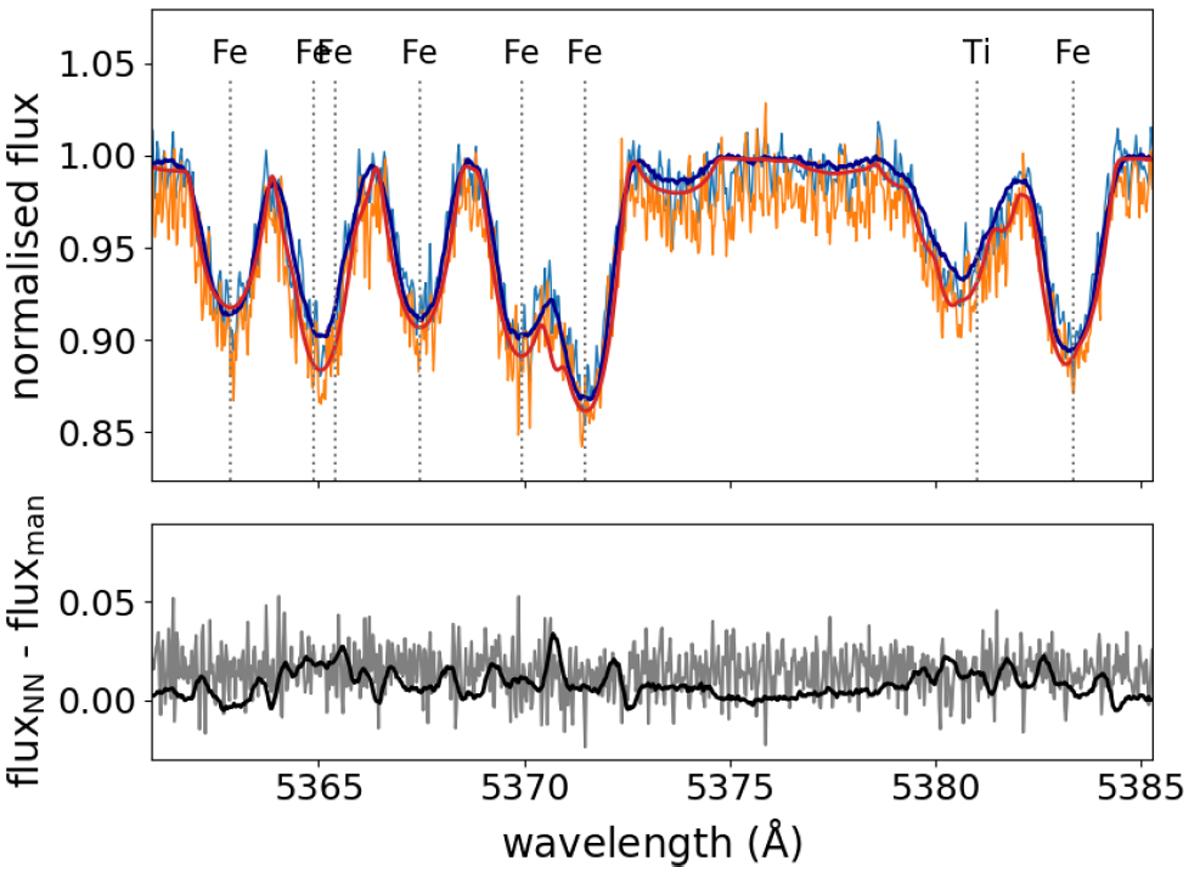
Comparison of automated NN and manual normalisation for part of the spectrum of KIC 7023122. The NN normalisation and best fitting predicted spectrum are shown in blue and dark blue. The manually normalised spectrum and a synthetic spectrum computed for the corresponding parameters from Van Reeth et al. (2015) are plotted in orange and red. The lower panel shows the difference between the automated and manually normalised spectrum in grey, and the black line is the difference between the synthetic spectra. The most prominent element lines are indicated by dotted lines.
Current usage metrics show cumulative count of Article Views (full-text article views including HTML views, PDF and ePub downloads, according to the available data) and Abstracts Views on Vision4Press platform.
Data correspond to usage on the plateform after 2015. The current usage metrics is available 48-96 hours after online publication and is updated daily on week days.
Initial download of the metrics may take a while.