Fig. 19
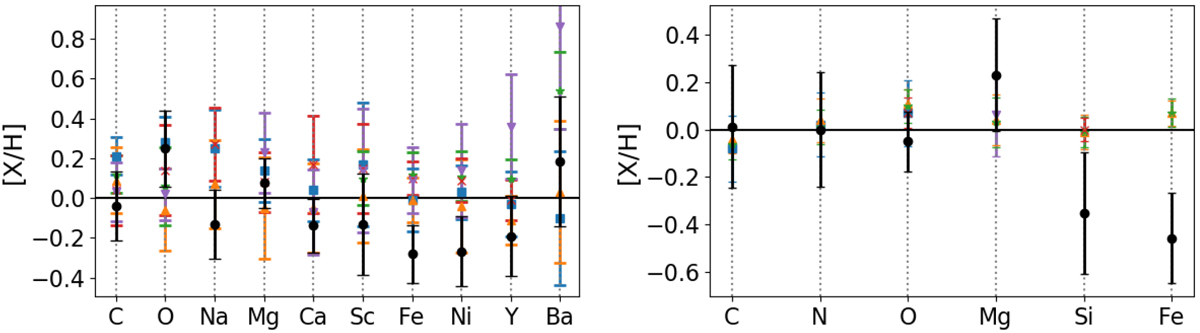
Left: comparison of the mean element abundances from the γ Dor sample (black dots) with abundance values for non-pulsating stars from Varenne & Monier (1999; blue squares), Monier (2005; orange triangles), Gebran et al. (2008; green stars), Gebran et al. (2010; red crosses), and K"i"l"i"çoğlu et al. (2016; purple reversed triangles). Right: comparison of the mean element abundances from the SPB sample (black dots) with abundance values for non-pulsating stars from Lyubimkov et al. (2005; purple reversed triangles), Simón-Díaz (2010; red crosses), Nieva & Simón-Díaz (2011; orange triangles), Nieva & Przybilla (2012; green stars), and Lyubimkov et al. (2013; blue squares).
Current usage metrics show cumulative count of Article Views (full-text article views including HTML views, PDF and ePub downloads, according to the available data) and Abstracts Views on Vision4Press platform.
Data correspond to usage on the plateform after 2015. The current usage metrics is available 48-96 hours after online publication and is updated daily on week days.
Initial download of the metrics may take a while.