Fig. 11
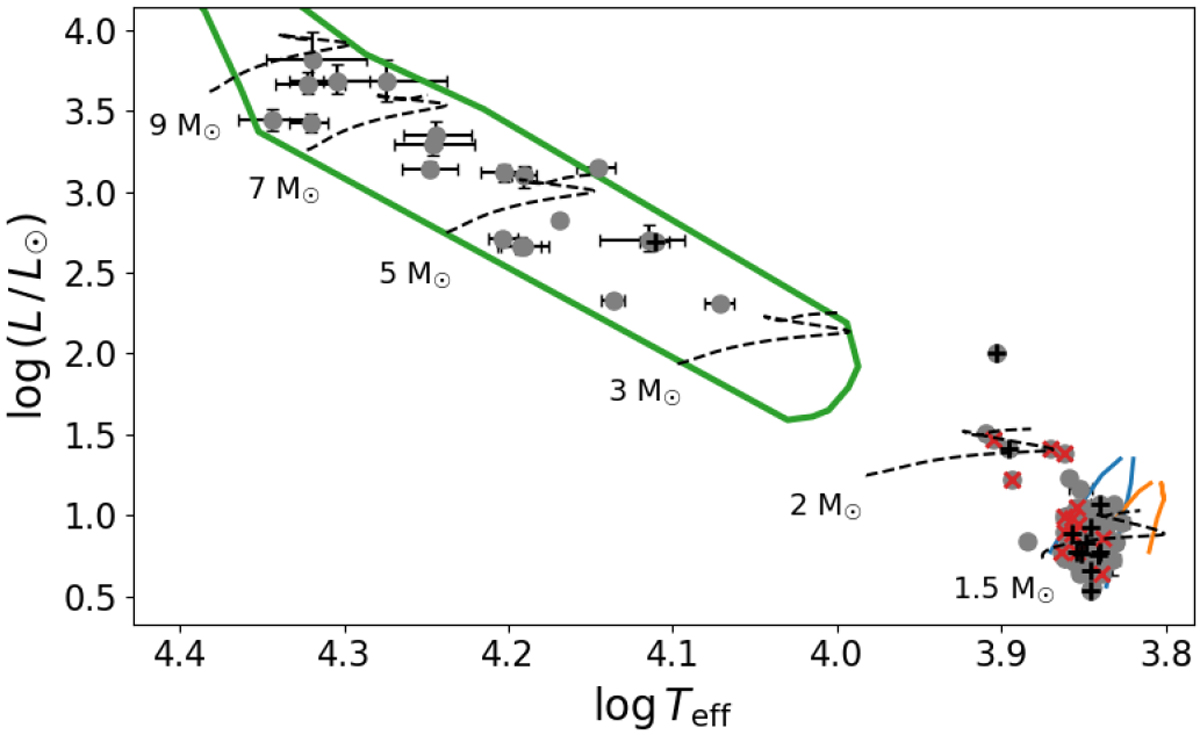
Hertzsprung-Russell diagram containing the γ Dor and SPB stars studied in this work. The γ Dor instability strips are from Dupret et al. (2005), for αmlt = 1.5 (orange) andαmlt = 2.0 (blue), while the SPB instability strip (green) is taken from Szewczuk & Daszyńska-Daszkiewicz (2017). All these strips were computed for solar metallicity. The red crosses are hybrid γ Dor - δ Sct stars, and the black pluses are SB1 stars. Evolutionary tracks for different masses taken from (Johnston et al. 2019) and covering from zero age- to the terminal-age main sequence are plotted as black dashed lines to guide the eye.
Current usage metrics show cumulative count of Article Views (full-text article views including HTML views, PDF and ePub downloads, according to the available data) and Abstracts Views on Vision4Press platform.
Data correspond to usage on the plateform after 2015. The current usage metrics is available 48-96 hours after online publication and is updated daily on week days.
Initial download of the metrics may take a while.