Fig. 6.
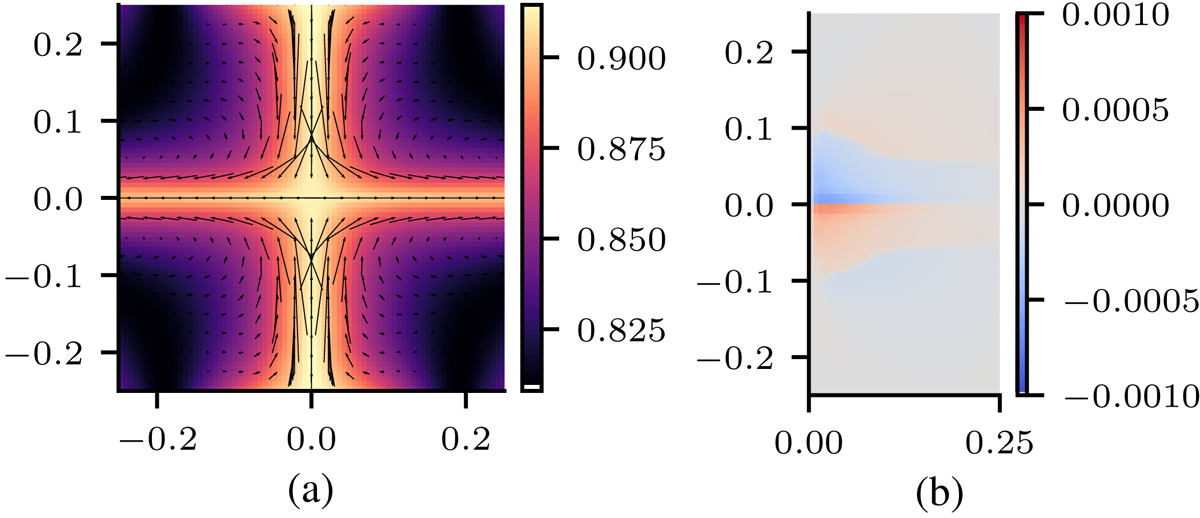
Velocity imbalance above and below the null point. Panel a: slice of the pressure through y = 0 overlaid with fluid velocity, where the longest arrows correspond to a fluid velocity of approximately 0.1. Panel b: |ux(x)| − |ux(−x)|, the difference in ux between the left and right sides of the plane x = 0. This gives a measure of the asymmetry in the velocity around the null point.
Current usage metrics show cumulative count of Article Views (full-text article views including HTML views, PDF and ePub downloads, according to the available data) and Abstracts Views on Vision4Press platform.
Data correspond to usage on the plateform after 2015. The current usage metrics is available 48-96 hours after online publication and is updated daily on week days.
Initial download of the metrics may take a while.