Fig. 5.
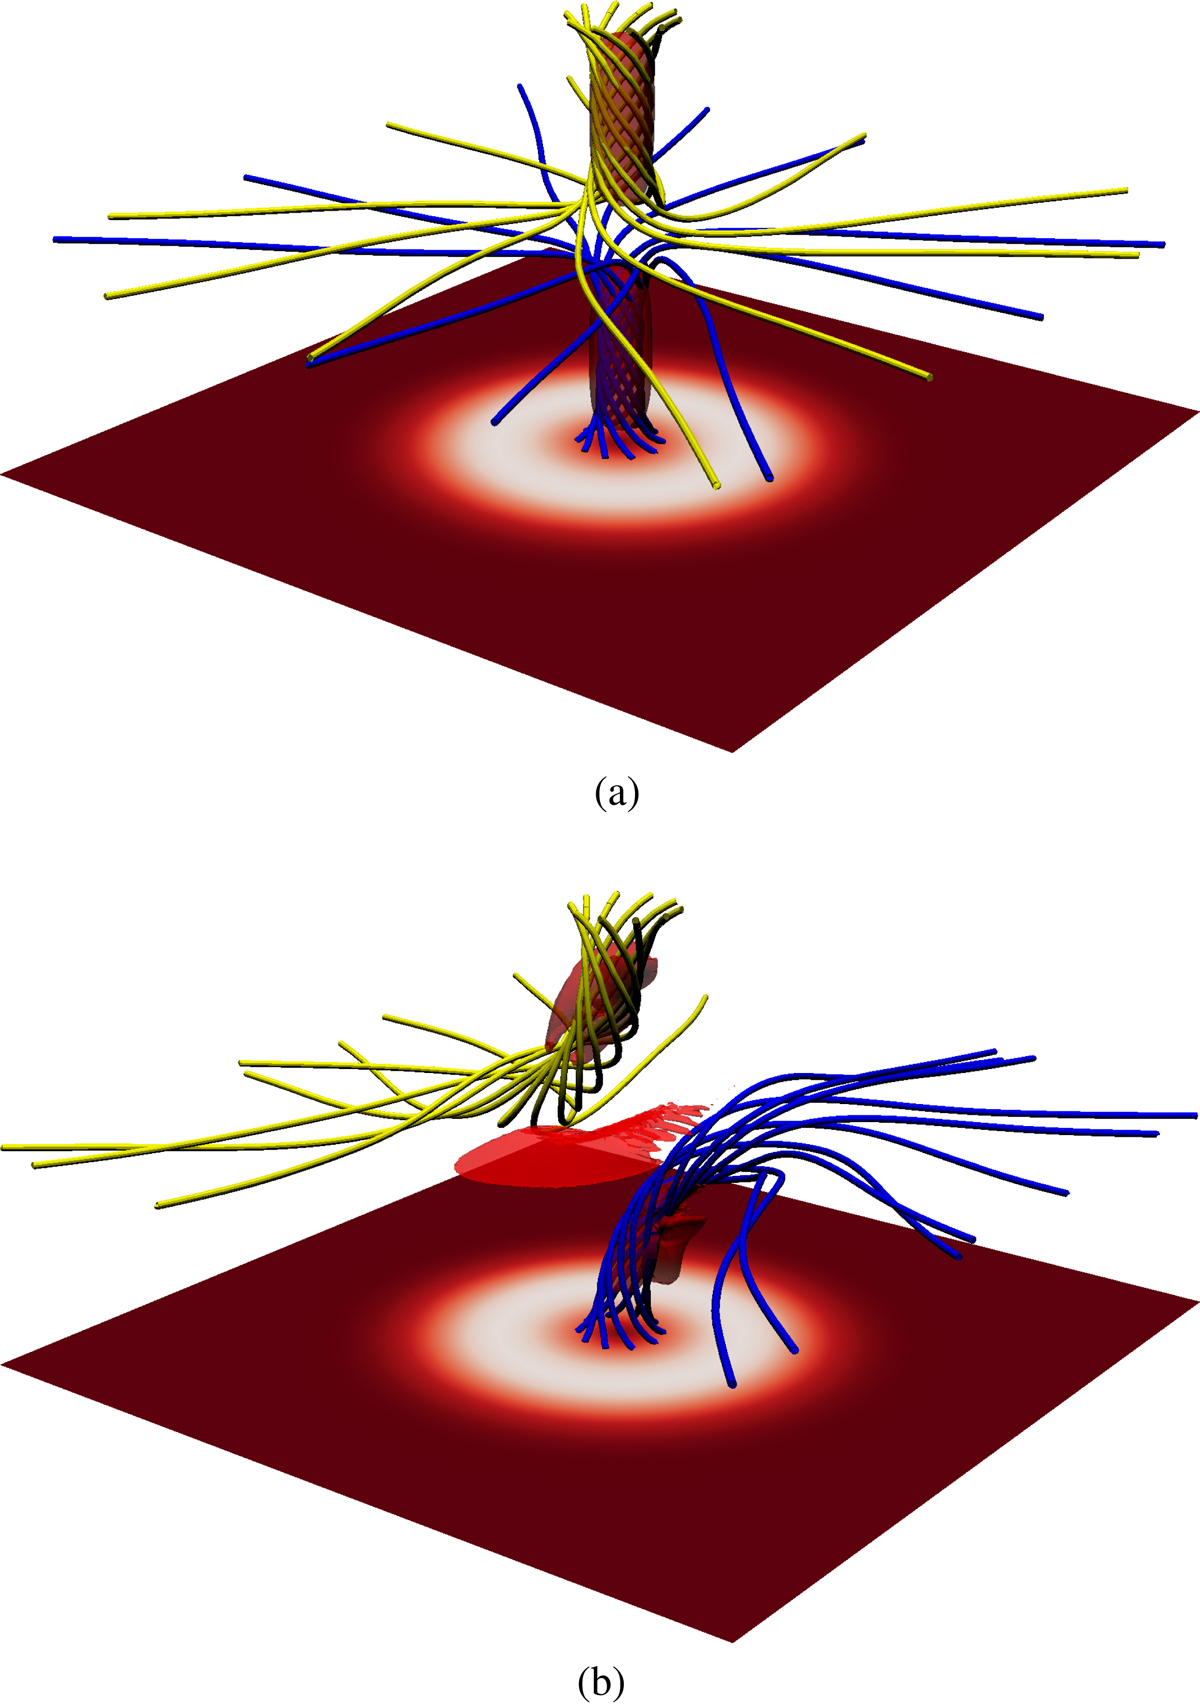
Collapse of the null point visualised with field lines in the isotropic case. Field lines are plotted from a circle of radius 0.05 around the upper and lower spine footpoints. Contours of |j| = 60 are also plotted and reveal the strong current within the spine as well as the formation of the central sheet associated with the spine-fan reconnection. At t = 18.5 the bulk of the field lines making up the core of the spine have reconnected.
Current usage metrics show cumulative count of Article Views (full-text article views including HTML views, PDF and ePub downloads, according to the available data) and Abstracts Views on Vision4Press platform.
Data correspond to usage on the plateform after 2015. The current usage metrics is available 48-96 hours after online publication and is updated daily on week days.
Initial download of the metrics may take a while.