Fig. 4.
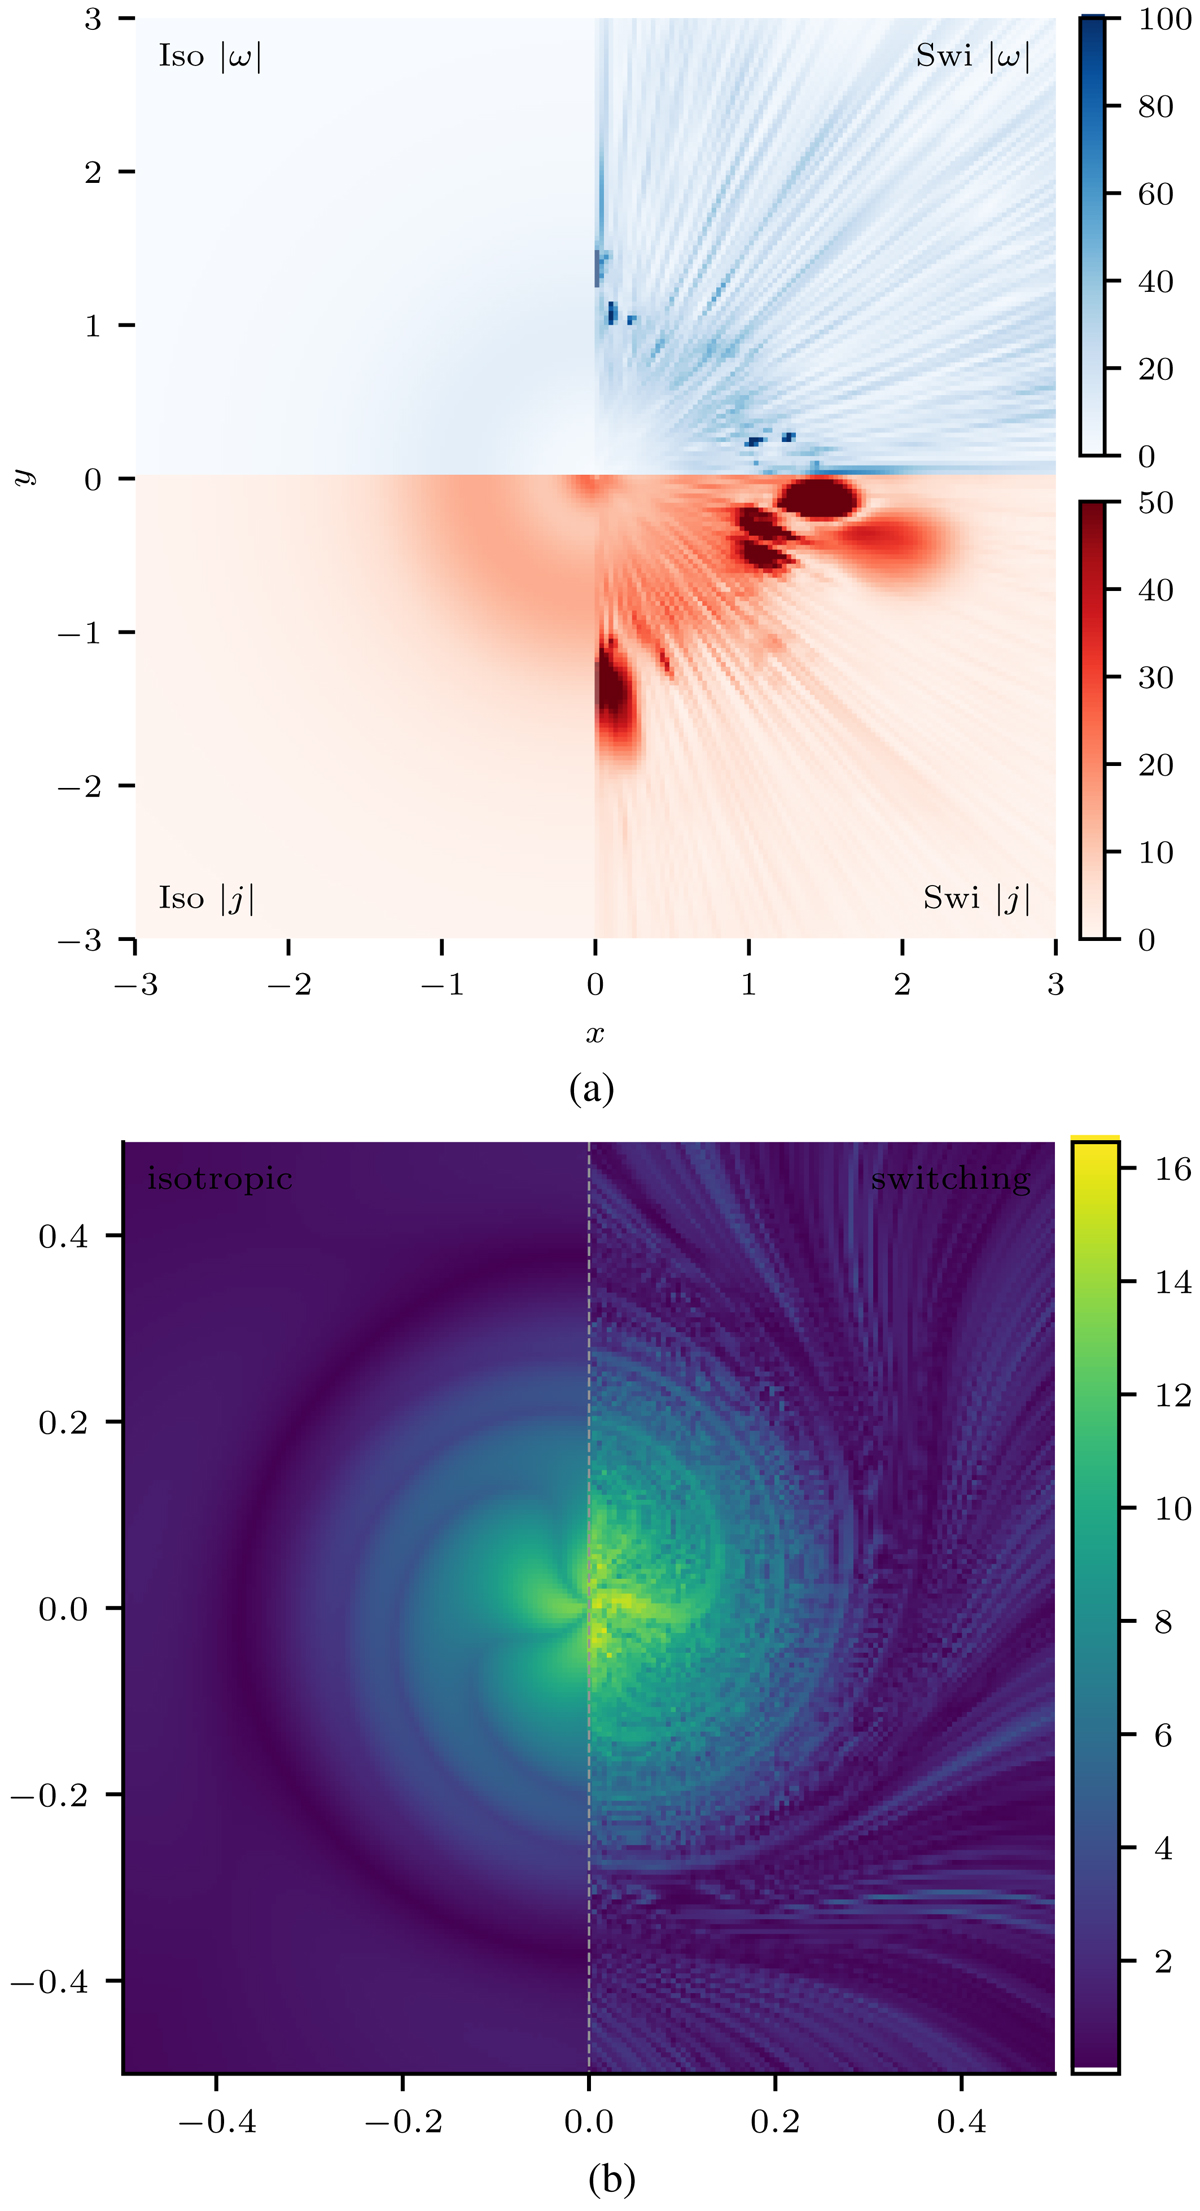
Breakup of the current-vortex sheet and associated reconnection at t = 10. Panel a: current and vorticity density at z = 0. Panel b: spatial distribution of reconnection rate measured as the parallel electric field integrated along field lines traced from locations in the plane z = 0.23. Both panels show both viscosity models with isotropic shown on the left half of each figure and switching on the right. The current-vortex sheet remains stable in the isotropic case while that in the switching case has been fragmented by the KHI. The resultant small-scale reconnection in the rolls produces localised pockets of strong vorticity and current density.
Current usage metrics show cumulative count of Article Views (full-text article views including HTML views, PDF and ePub downloads, according to the available data) and Abstracts Views on Vision4Press platform.
Data correspond to usage on the plateform after 2015. The current usage metrics is available 48-96 hours after online publication and is updated daily on week days.
Initial download of the metrics may take a while.