Fig. 7
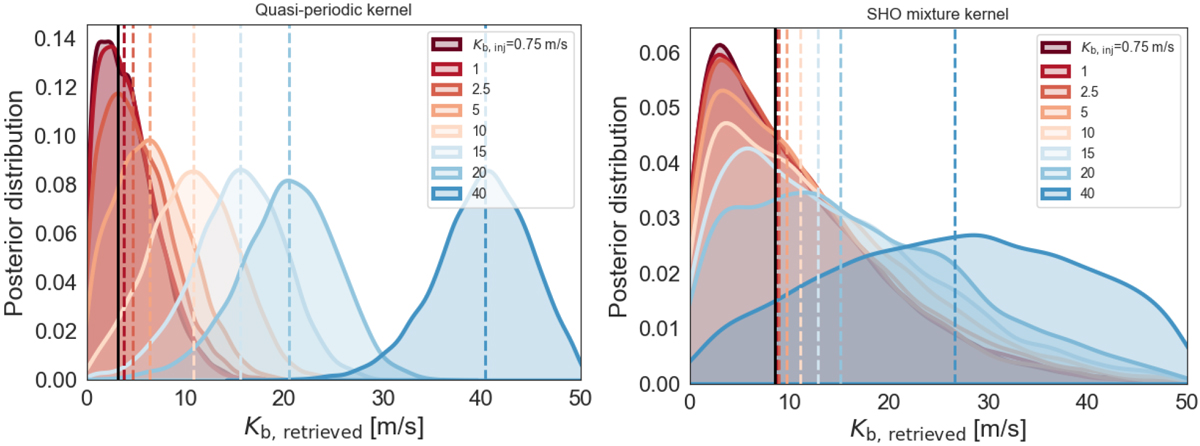
Posteriors of the Kb parameterretrieved from the simulations involving the original RV datasets, with the injected Kb, inj values indicated in the legend. The vertical dashed lines represent the median of the posteriors of the corresponding colour. The vertical black lines indicates the median of the posteriors for the real data (3.2 and 8.6 m s−1), as a reference.
Current usage metrics show cumulative count of Article Views (full-text article views including HTML views, PDF and ePub downloads, according to the available data) and Abstracts Views on Vision4Press platform.
Data correspond to usage on the plateform after 2015. The current usage metrics is available 48-96 hours after online publication and is updated daily on week days.
Initial download of the metrics may take a while.