Free Access
Fig. 19
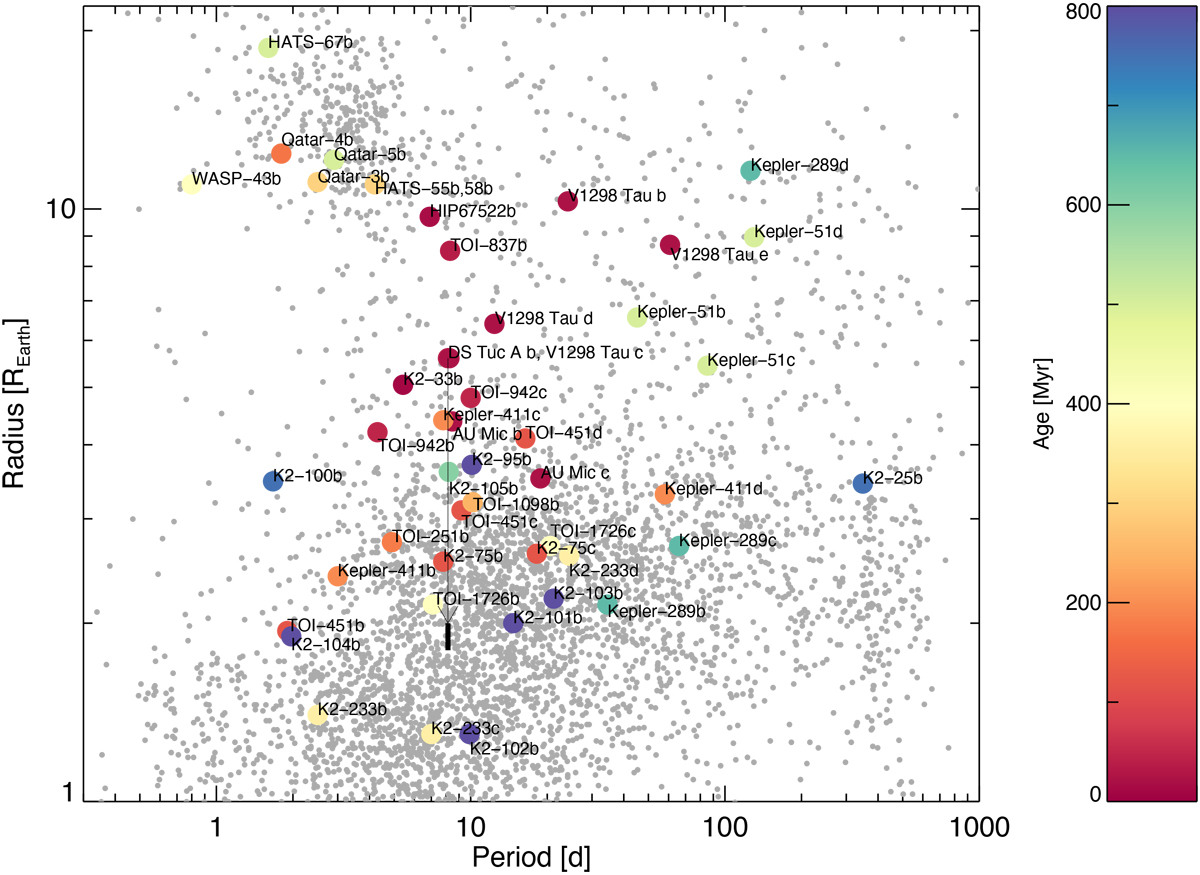
Planetary period-radius diagram for the sample of characterised young transiting planets as a function of the stellar age. Grey dots represent all the known planets with measured period and radius. Black bar line indicates the locus of the final radius of DS Tuc A b according to our planetary evolution models.
Current usage metrics show cumulative count of Article Views (full-text article views including HTML views, PDF and ePub downloads, according to the available data) and Abstracts Views on Vision4Press platform.
Data correspond to usage on the plateform after 2015. The current usage metrics is available 48-96 hours after online publication and is updated daily on week days.
Initial download of the metrics may take a while.