Fig. 18
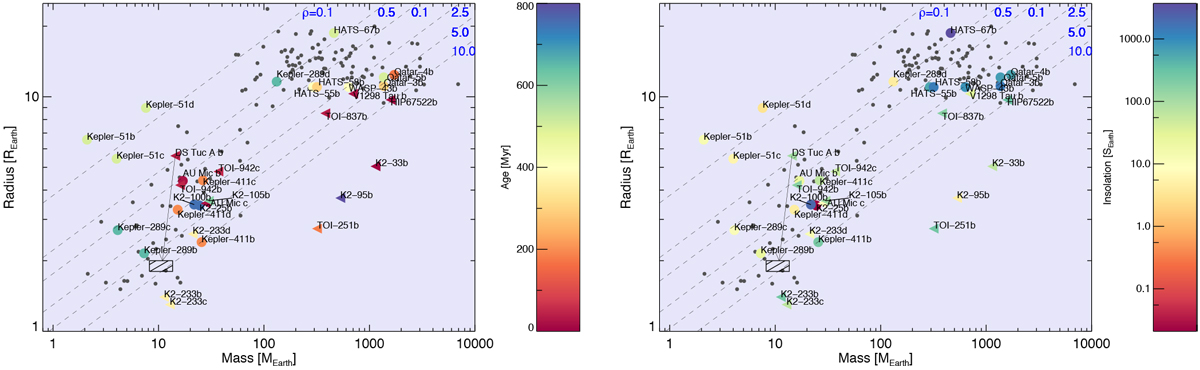
Planetary mass-radius diagram for a sample of characterised young transiting planets as a function of the stellar age (left) and planet insolation (right). Coloured circles indicate planet with measured mass, while triangles indicate planets withmass upper limit only. Grey dots represent a sample of well-characterised mature exoplanets for comparison. Dashed lines represent loci of equal density, as indicated at the top of the figure. Hatched rectangle indicates the locus of the final mass and radius of DS Tuc A b, according to our planetary evolution models.
Current usage metrics show cumulative count of Article Views (full-text article views including HTML views, PDF and ePub downloads, according to the available data) and Abstracts Views on Vision4Press platform.
Data correspond to usage on the plateform after 2015. The current usage metrics is available 48-96 hours after online publication and is updated daily on week days.
Initial download of the metrics may take a while.