Free Access
Fig. 15
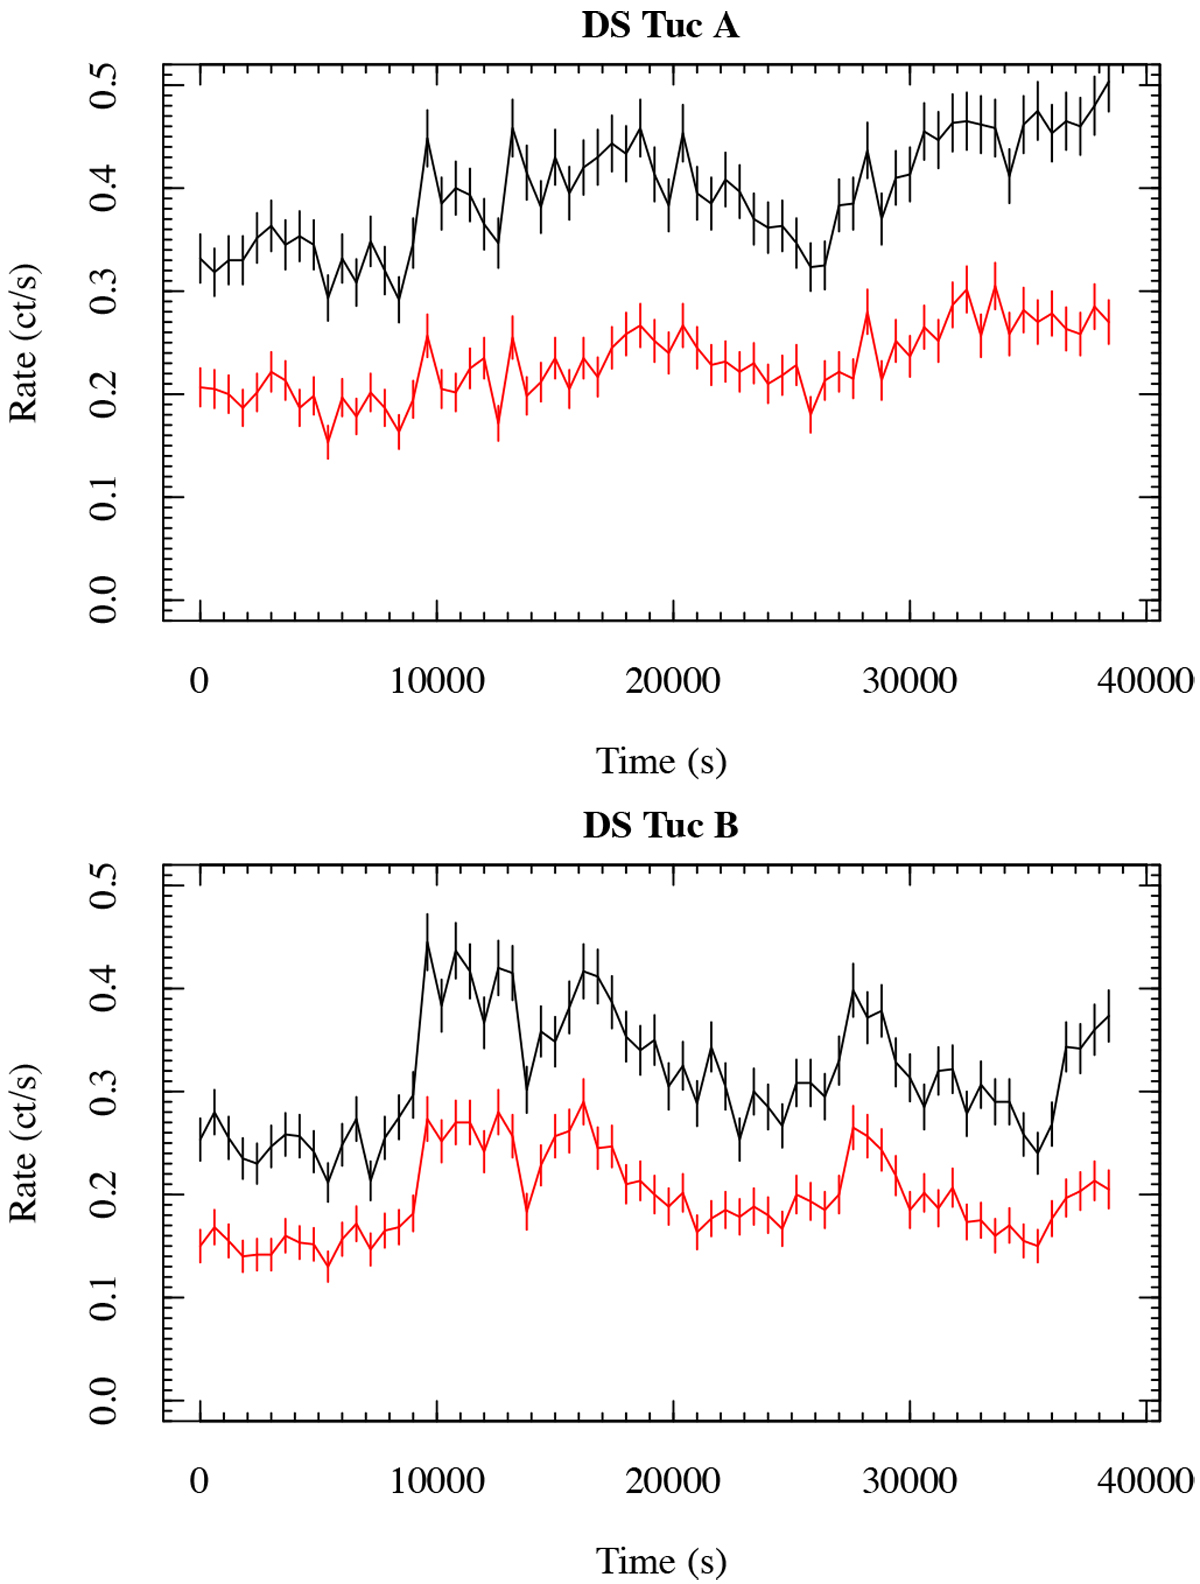
Mos1 light curves for both components of DS Tuc. Black line is the light curve from the semi-circular region of radius 30′′, red line is the light curve from the circular region of radius 10′′. Error bars on rates are at 68% confidence level. Upper panel: DS Tuc A. Lower panel: DS Tuc B.
Current usage metrics show cumulative count of Article Views (full-text article views including HTML views, PDF and ePub downloads, according to the available data) and Abstracts Views on Vision4Press platform.
Data correspond to usage on the plateform after 2015. The current usage metrics is available 48-96 hours after online publication and is updated daily on week days.
Initial download of the metrics may take a while.