Fig. 13
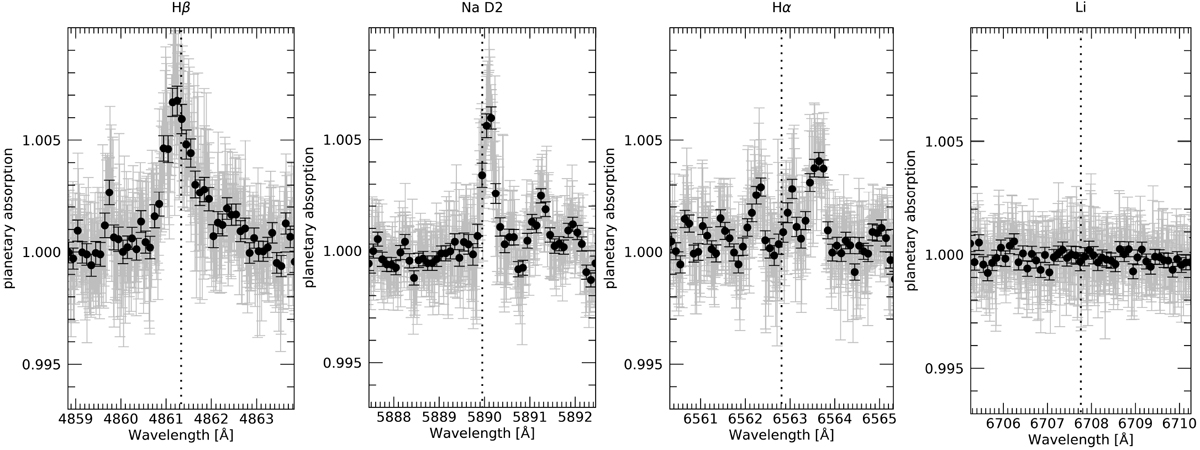
Transmission spectrum extracted in the zone of the Hβ (left panel), Na D2 (central left panel), Hα (central right panel), and Li (right panel) lines. The vertical dashed lines show the planetary restframe. Black points refer to 0.1 Angstrom binning. Different lines we searched for are affected by the contamination given by the stellar activity in different ways.
Current usage metrics show cumulative count of Article Views (full-text article views including HTML views, PDF and ePub downloads, according to the available data) and Abstracts Views on Vision4Press platform.
Data correspond to usage on the plateform after 2015. The current usage metrics is available 48-96 hours after online publication and is updated daily on week days.
Initial download of the metrics may take a while.