Fig. 5
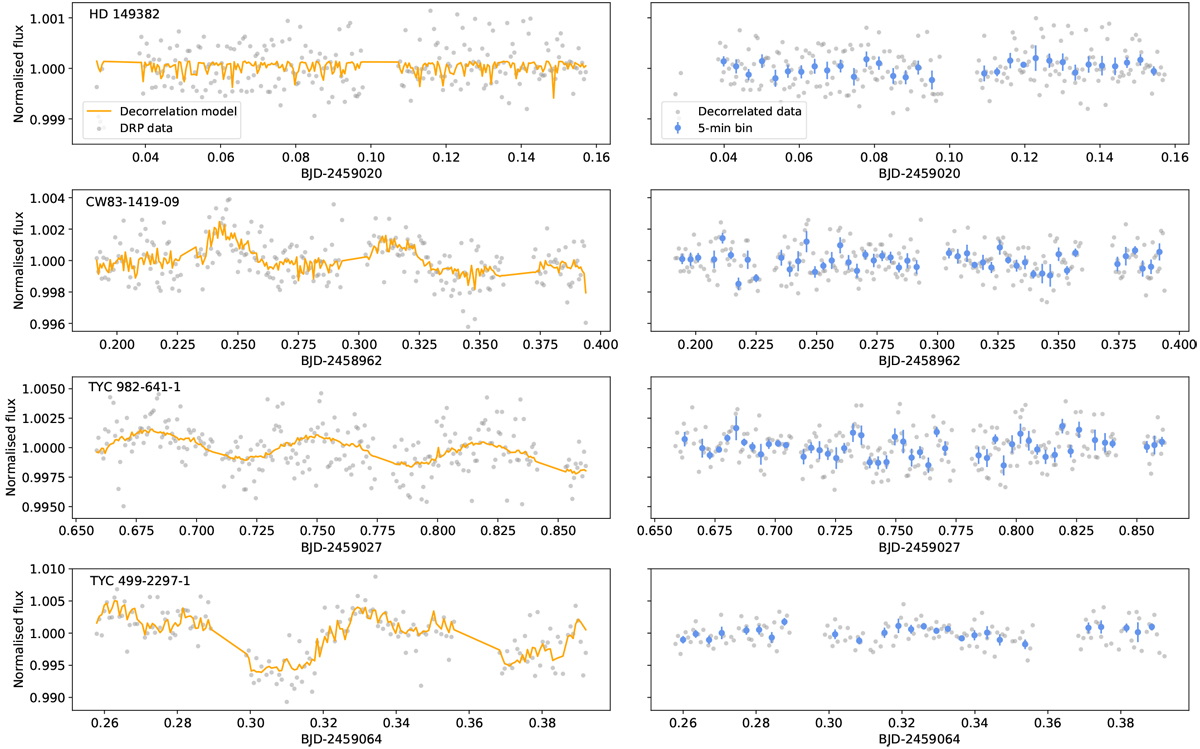
Representative light curves of hot subdwarfs produced by CHEOPS. From top to bottom: HD 149382 (G = 8.9) in its fifth visit, CW83 1419-09 (G = 12.0) in its first visit, TYC 982-6141 (G = 12.2) in its fourth visit, and TYC 499-2297-1 (G = 12.6) in its fourth visit. In all cases, the raw light curves as processed by the DRP (gray dots) are displayed in the left panels, jointly with the best decorrelation model (orange line) found by means of the pycheops package. In the right panels, the decorrelated data (gray dots) with a 5-min bin (blue dots) are shown. The y-scale is the same for each pair of right and left panels.
Current usage metrics show cumulative count of Article Views (full-text article views including HTML views, PDF and ePub downloads, according to the available data) and Abstracts Views on Vision4Press platform.
Data correspond to usage on the plateform after 2015. The current usage metrics is available 48-96 hours after online publication and is updated daily on week days.
Initial download of the metrics may take a while.