Fig. D.1.
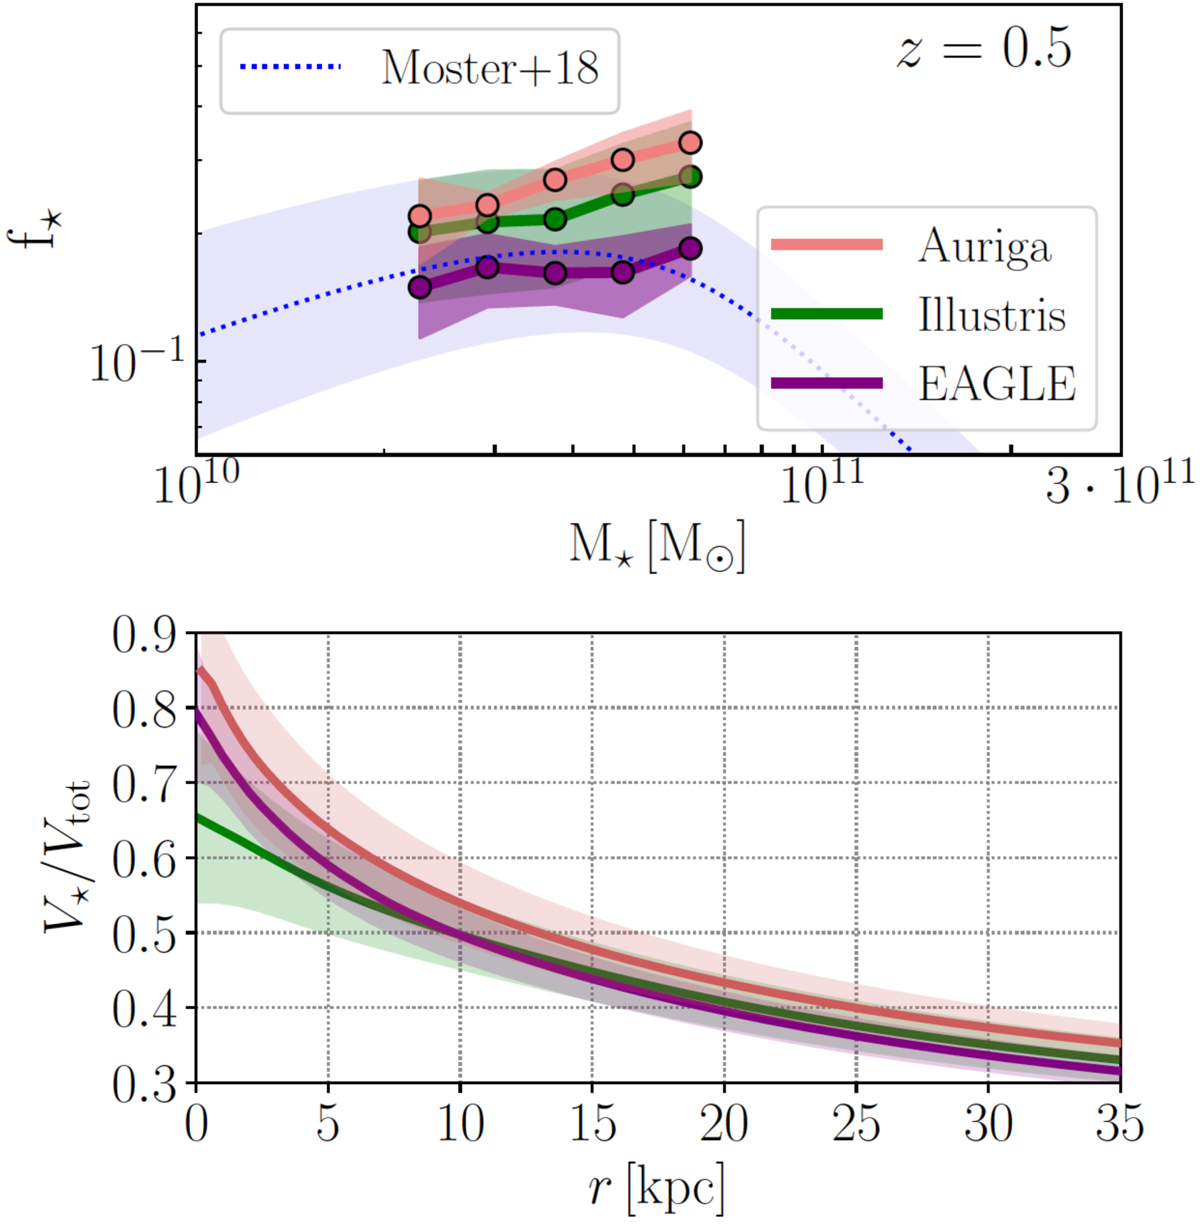
Stellar-to-dark matter ratios at higher redshifts. Top: f⋆ vs. M⋆ for Auriga, EAGLE, and Illustris disc galaxies at z = 0.5. The dotted blue line denotes the relation determined using the Moster et al. (2018) abundance matching relation, and the shaded region denotes the 1σ scatter around the relation. Bottom: V⋆/Vtot for the galaxies shown in the top panel. Auriga is already locally more baryon-dominated than EAGLE and Illustris at higher redshifts.
Current usage metrics show cumulative count of Article Views (full-text article views including HTML views, PDF and ePub downloads, according to the available data) and Abstracts Views on Vision4Press platform.
Data correspond to usage on the plateform after 2015. The current usage metrics is available 48-96 hours after online publication and is updated daily on week days.
Initial download of the metrics may take a while.